We are just getting over the not so shocking election result in UK (8th June 2017).
I wanted to look at house prices and how they are affected by election results.
The graphs below plot House Price/ Number of Transactions against date (blue dots). The data is averaged over a month and is normalised to 1.0.
The vertical lines represent UK general elections with blue representing clear results (clear majority) and black lines representing hung Parliament. There is a black line (2nd from right) that represents EU Referendum (‘Brexit’).
The orange dots represent GBP (Sterling) performing against INR (Indian Rupee) and CNY (Chinese Yuan). The data is daily average normalised to 1.0.
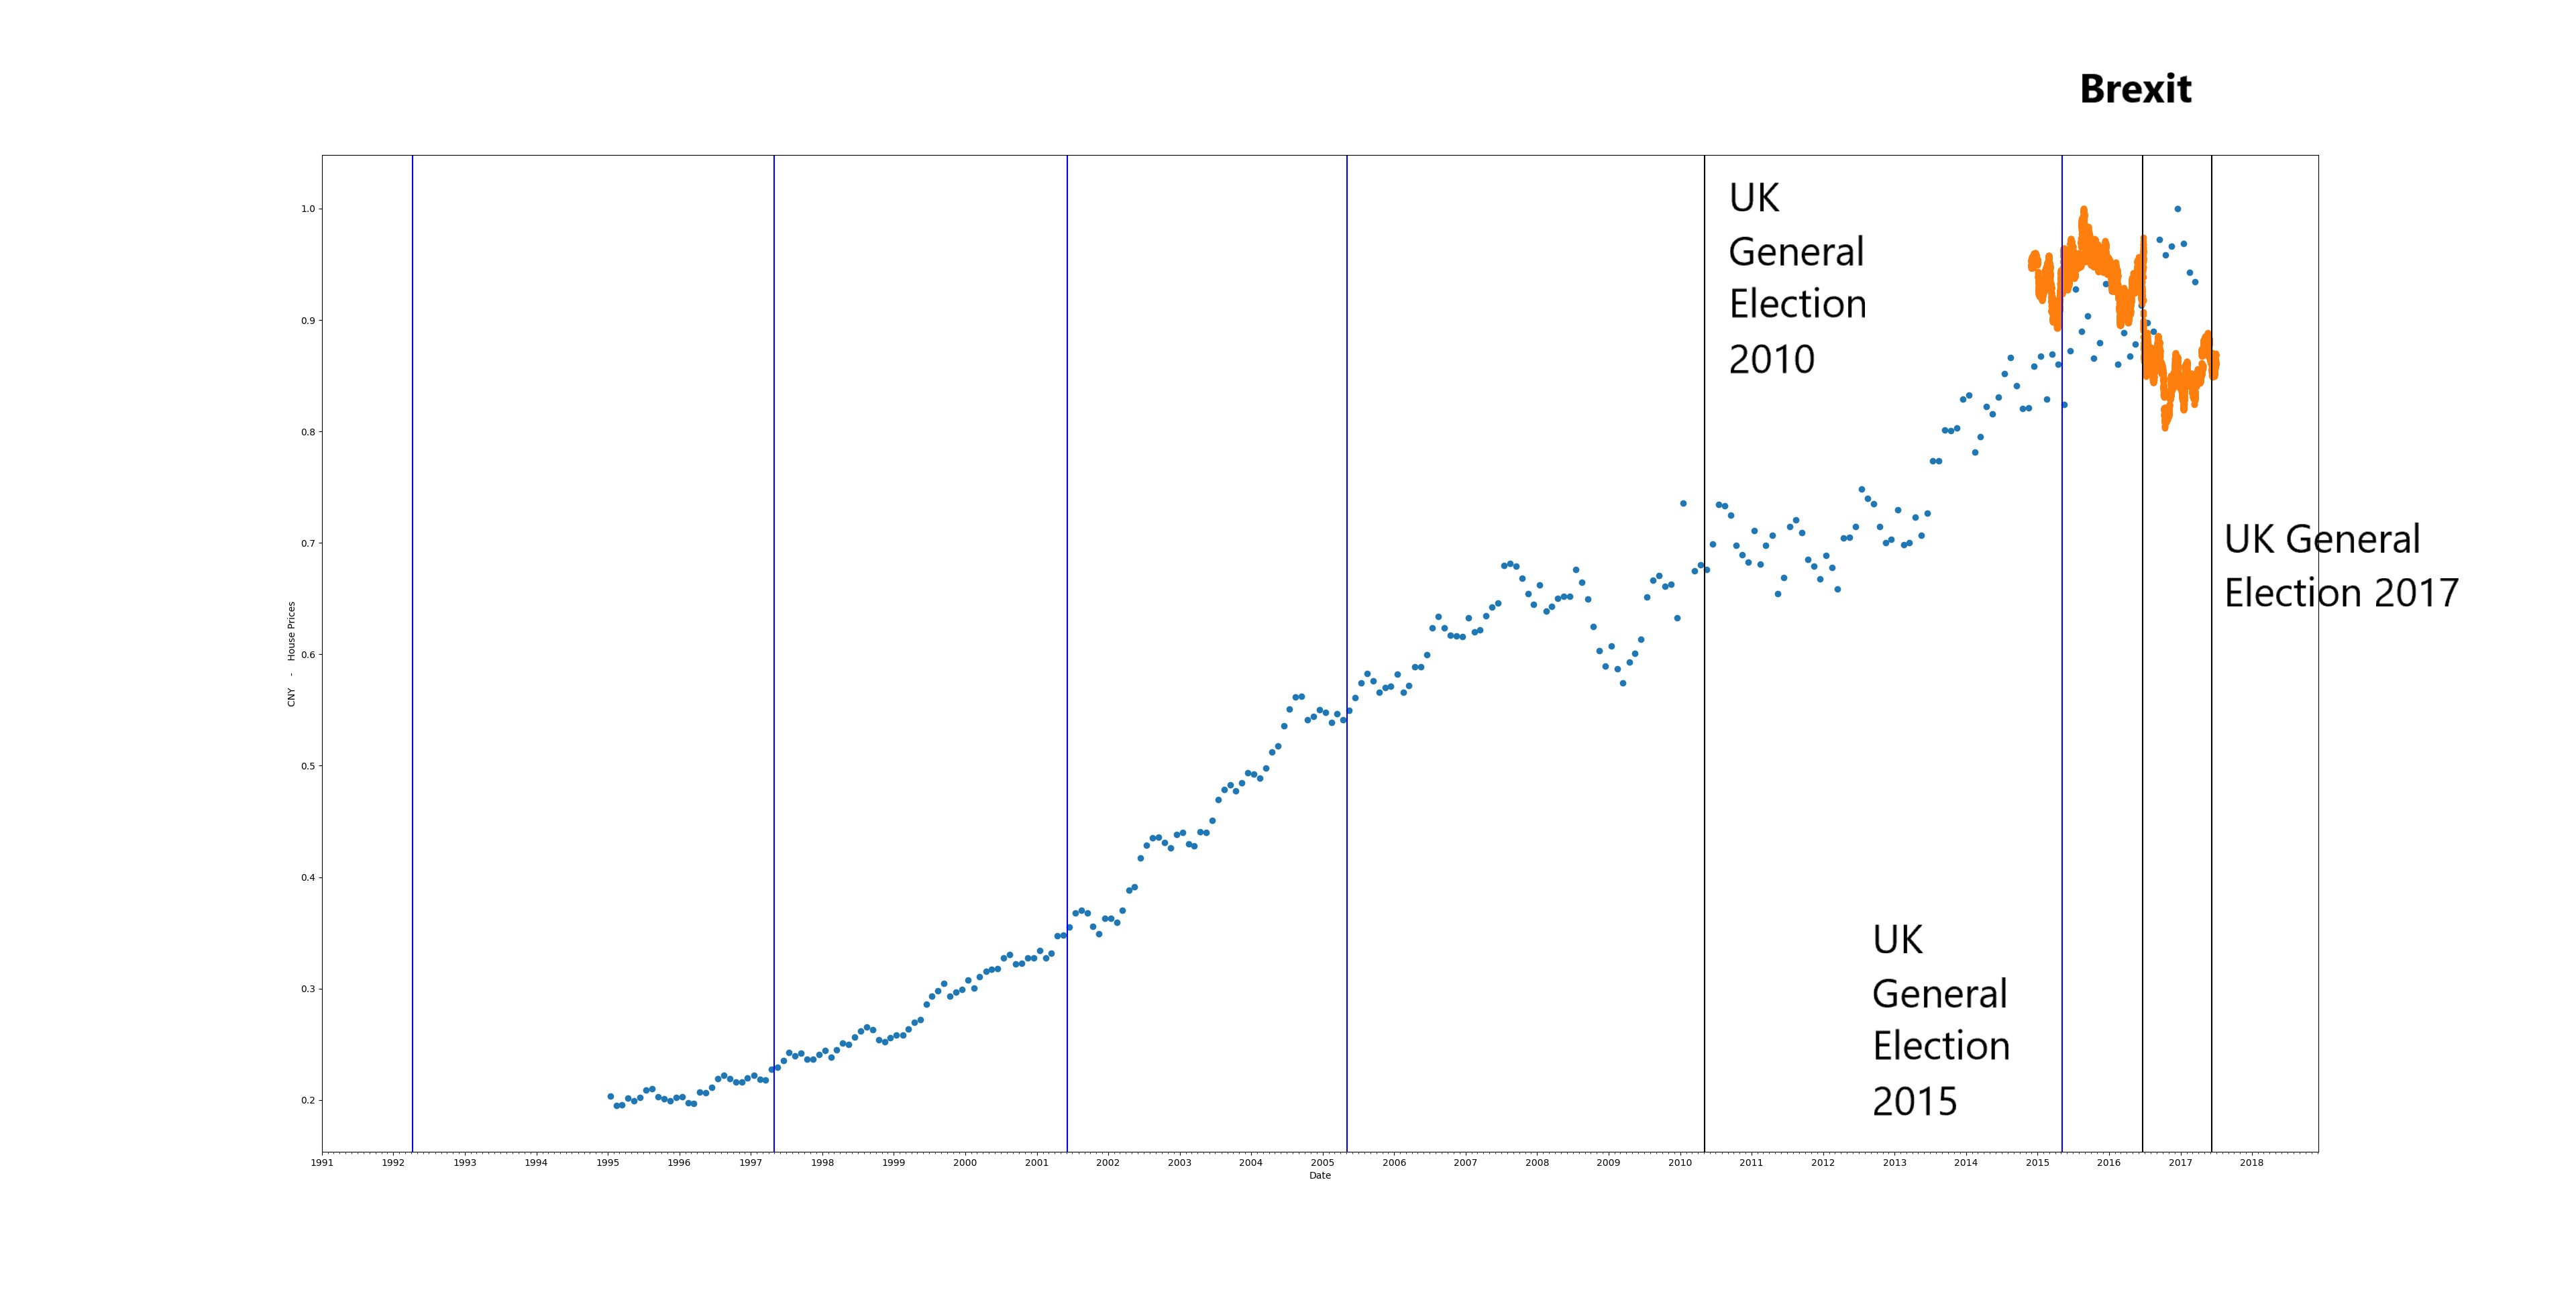
We can see house prices grow aggressively after clear results. The period from 2008 onward is the ‘financial’ crisis era which is further complicated by a hung Parliament in 2010. The actual recovery takes a few years and by 2014 the boom times are back! The growth is further enhanced by a Conservative majority in 2015.
It is too early to see the impact of Brexit on the housing market but as far as GBP goes there has been a fall against all major currencies.
This means investment into the UK housing market is made cheaper for ‘international’ buyers. The growth in house prices is compensated by the fall in the pound (we can see this by the relative falls in the two graphs).
Already the house price increase is cooling off (falling in many regions where they were over-inflated to begin with). With the messy general election of 2017 increasing the uncertainty, especially around Brexit, the house prices from internal demand should decrease or flatten out. We can already see this starting. People might rush in to lock their mortgage (thereby boosting short term demand) as Bank of England has indicated a rise in Interest Rates in the near future.
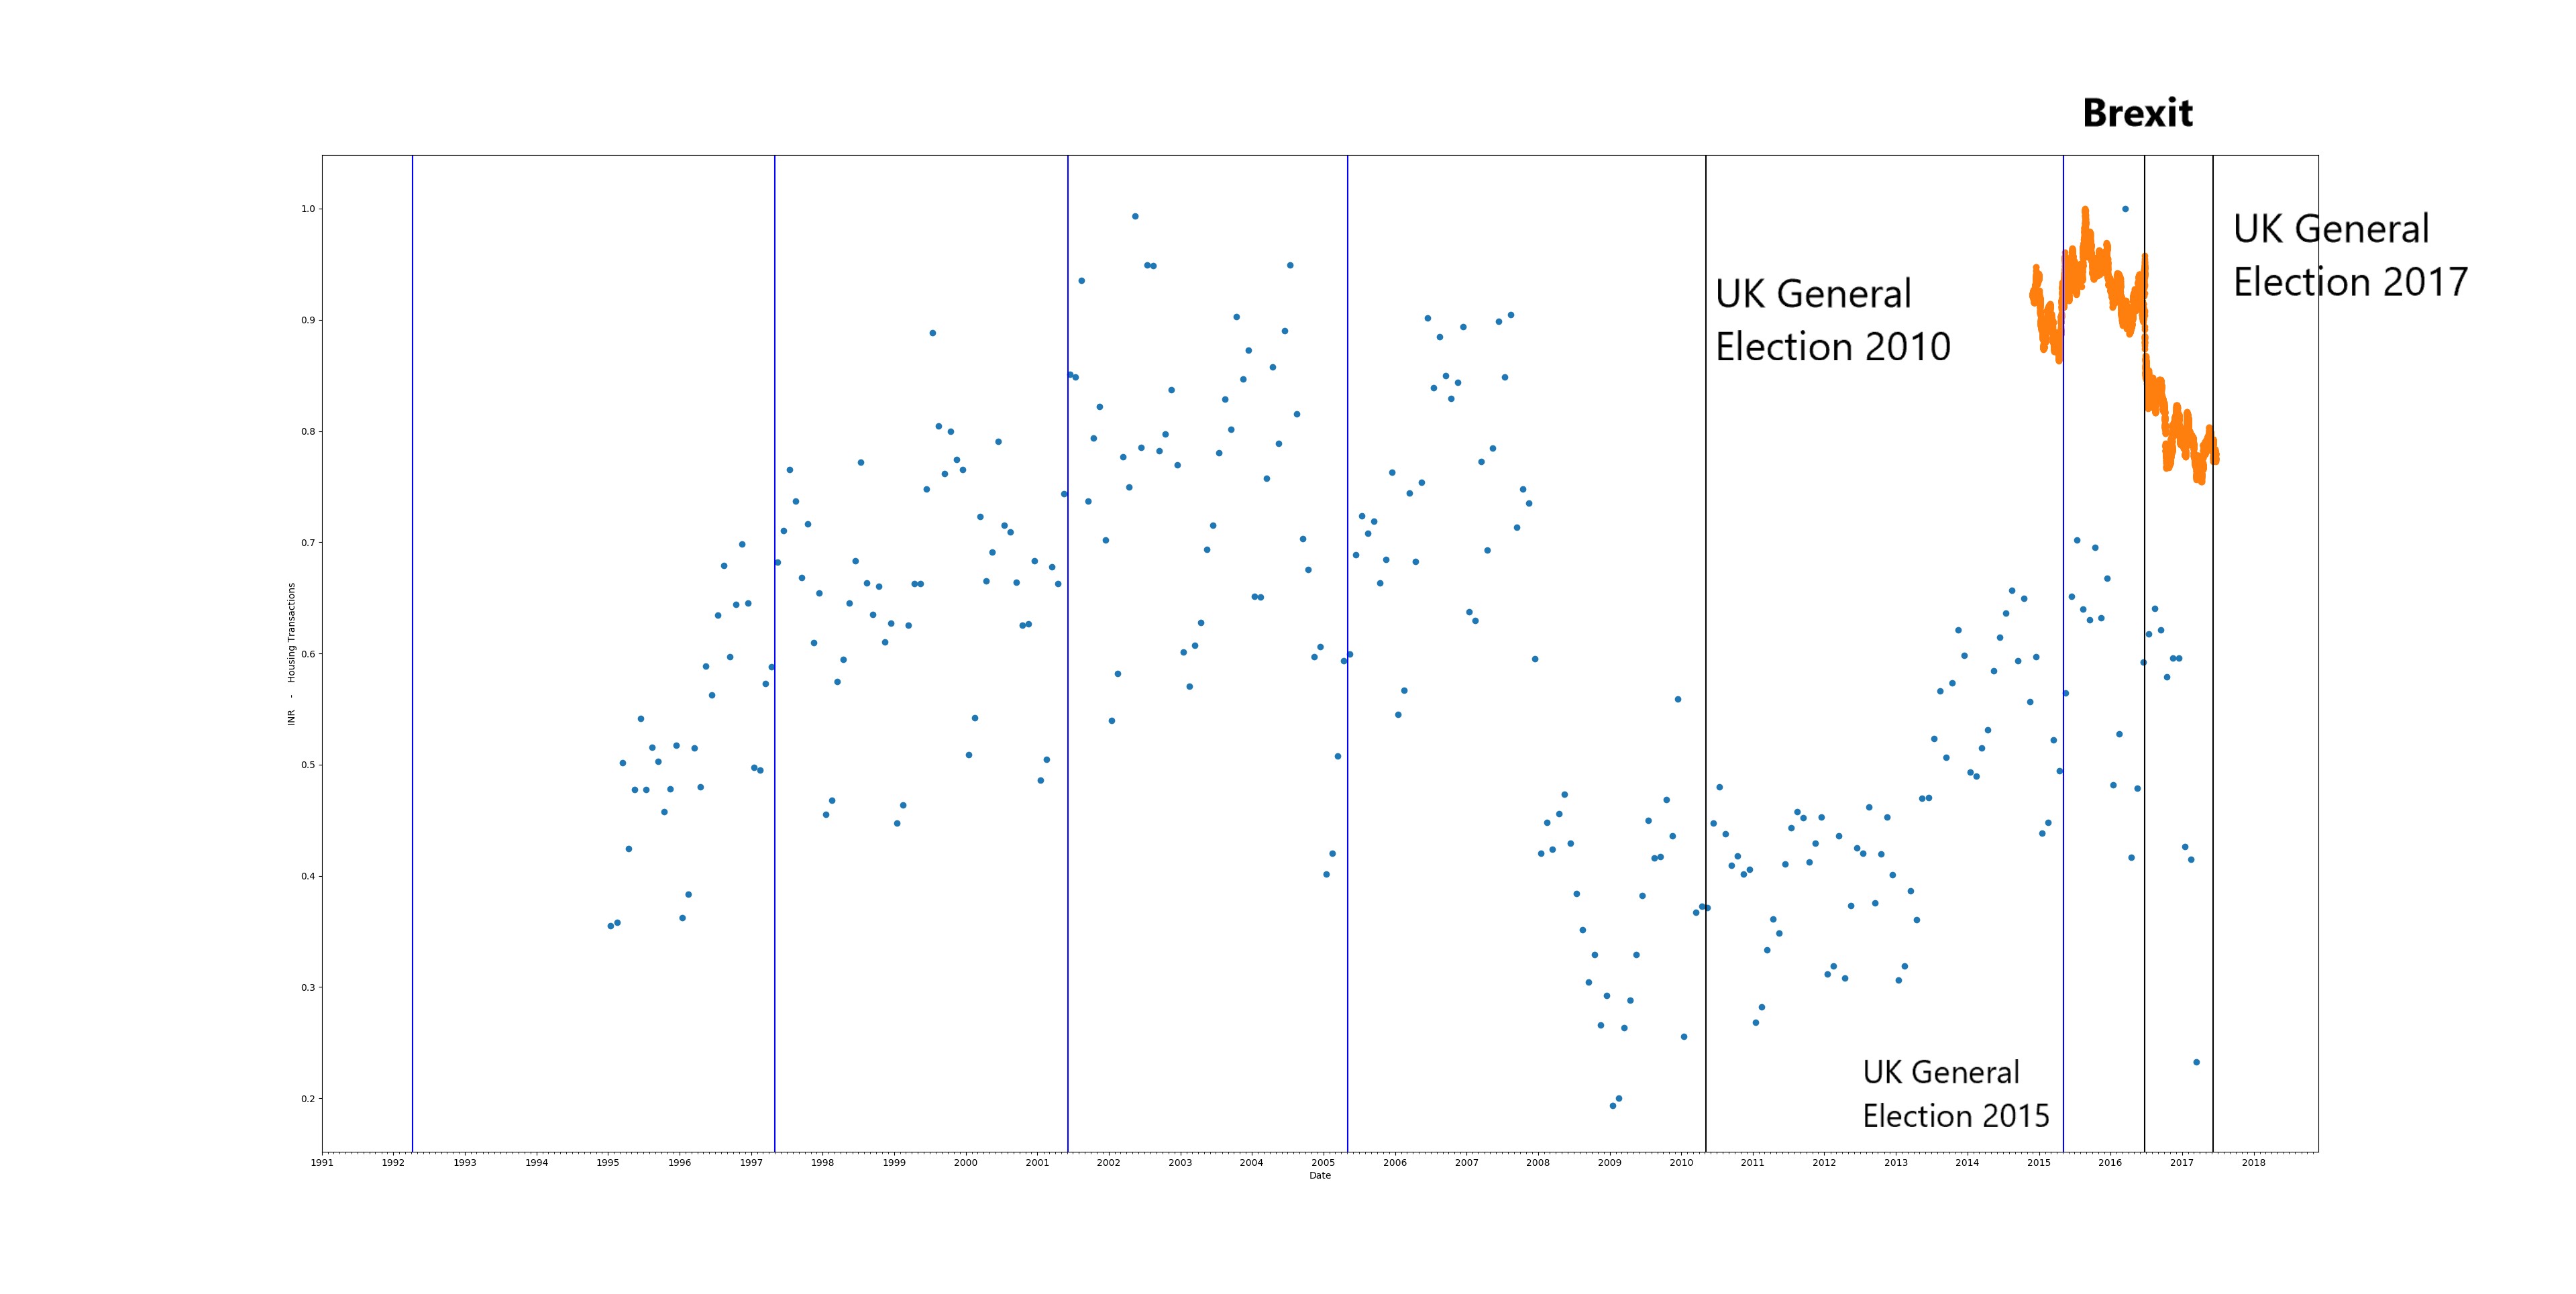 What happens if look at the number of transactions? The normalised graph above shows that during the financial crisis era the transactions fell sharply. Then began to revive (correlates with the rise in house prices). The strong position of the Conservatives further supported the market.
But as soon as the Stamp Duty increase came into the picture the number of transactions started reducing and after ‘Brexit’ leading up to the 2017 General Election we can see a sharp fall in transactions.
All of these things indicate that people are not sure about what will happen in the future so are not willing to take positions of risk.

A final interesting titbit – Why is there a massive spike in transactions in a subdued period of house sales (the red arrow)? And no this is not an error! The month is March 2016 – and the spike is there because stamp duty changes were being introduced from 1st April 2016 which meant buying a second home (without selling the first one) would become a lot more expensive!
[This analysis uses the Land Registry data set which is processed using Apache Spark, Python was used to further process and plot the data]
