- Post 1: the need for RAG
- Post 2: implementing RAG
- This post: measuring benefits of RAG
- Post 4: implementing RAG using LangChain
Understanding the Response
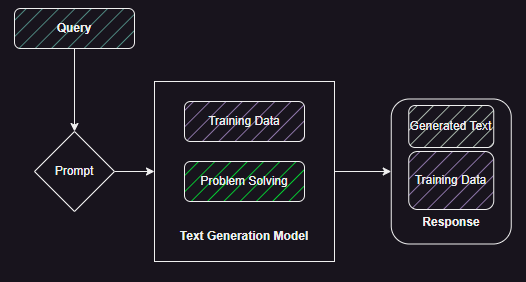
In this final post we understand how we can start to measure the performance of Retrieval Augmented Generation (RAG) and therefore estimate its value. Figure 1 shows the basic generation mechanism in Text Generation Models. The query has to trigger the correct problem solving paths which combines the training data to create a response. The response is a mix of text from the training data and newly generated text. This generated text can be an extrapolation based on the training data or it could be simply gluing the training data together without adding new facts.
For the enterprise question and answer use-case we want to start with the latter behaviour but tune it, as shown in Figure 2, to include relevant data from a proprietary database, minimize data from training, and control the generated text. So ideally, we want the model to use its problem solving capabilities to generate a response based on relevant proprietary data.
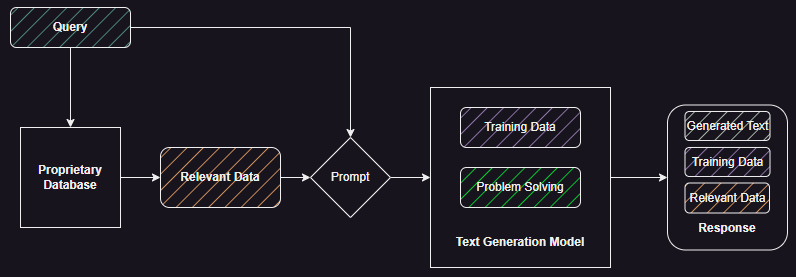
Figure 3 shows some possible combinations we can find in the response.

A response that consists of large amounts of generated text with little grounding in training data could be a possible hallucination. If the response is based mainly on training data with either generated text or data from proprietary database added to it we may find the response plausible but it may not be accurate.
To illustrate this with an example: say this was deployed on a retail website and the customer/agent wanted to ask about the return policy associated with a particular product. We want the model to use its problem solving (language generation) capabilities to generate the response, using the data associated with product policy available in the retailers database. We do not want it to create its own returns policy based on its training data (training data driven in Figure 3) or for it to get ‘creative’ and generate its own returns policy (hallucination). We also don’t want it to mix training data with proprietary data because there may be significant differences between generic return policies it may have observed during training and the specific policy associated with that product.
The ideal response (see Figure 3) consists of data retrieved from the proprietary database, where we can be assured of its accuracy, validity, and alignment with business strategy with the generated text used as a glue to explain the policy without adding, changing, or removing any part of it. In this case we are using the text comprehension (retrieved docs), problem solving (summarisation/expansion), and text generation skills of the model.
Building the Baseline
To evaluate the RAG response we need to build a baseline. This is critical for cases where the proprietary data is not entirely unique and similar examples may be present in the training data of the model being used. For example, standard terms and conditions that have been customised for an organisation. In this case, it is important to run the common queries we expect against the model without any supporting proprietary data (see Figure 1). This tells us what answer does the model give based purely on training data and how is it different from the the organisation specific answer.
Therefore, to build the baseline we create a corpus of questions (both relevant and nonsensical) that we believe the customers would ask and interrogate the selected model. The analysis of the response tells us what the model knows and which class of undesired responses are most common. This analysis must be done by subject matter experts to ensure semantic correctness.
Running with RAG
Using the same corpus of questions with RAG pipeline allows us to generate what we expect to be accurate and focused responses. We can compare these with the baseline and weed out cases where the model is focusing more on the training (generic) data than the retrieved proprietary data.
Ideally, we want the RAG response to be different from the non-RAG responses for the same question. For the case where the proprietary data is unique (e.g., customer interactions, transactions, internal company policies, etc.) this difference should be quite significant. We should evaluate this difference both objectively (say using embedding vectors – see next section) as well as subjectively using subject matter experts.
We should analyse the response where the question was not related to the domain of the organisation to protect against different prompt-based attacks. These should produce some response from the model when we are not using RAG. When we use RAG we should be able to block the request to the model because we do not find relevant data in the proprietary database.
Building a corpus of questions also allows us to cache the model response thereby reducing runtime costs. This would require first checking the question against a cache of answered questions and running the RAG pipeline only if the question is not found in the cache or there is significant difference (e.g., using embedding vector distance).
Comparing the Output
The basic requirement here is to compare the response generated with and without RAG, and proving that RAG response is accurate and safe even when asked unrelated or nonsensical questions.
There are various objective metrics we can look at.
Firstly, we can compare the amount of text generated with and without RAG. We would expect on common topics the generated text may be similar in length but on unique topics there must be a significant difference.
Secondly, we can use an embedding generating model (e.g., sentence-transformers/all-MiniLM-L6-v2) to create embeddings from the RAG and non-RAG responses. These can then be compared using similarity metrics.
Thirdly, we can use subject matter experts and customer panels to manually evaluate the responses (without revealing which answer was generated with/without RAG). What we should find is a clear preference for the RAG answer.
In this post we will focus on comparing the amount of text generated as well as the similarity between the RAG and non-RAG response.
If we find no significant difference between RAG and non-RAG response and no clear preference for the RAG response then the dataset may be a good target for non-generative AI based methods that are significantly cheaper to run.
An Example
It is always good to get your hands dirty to explore a topic. I built my own RAG pipeline using using my blog posts as the source of proprietary data.
Step 1: Review the documents in the data store and build the corpus with a mix of related and unrelated questions.
Step 2: Build the RAG pipeline – see the second post. Three major components are: Milvus vector database, sentence transformer for similarity, and GPT4 as the text generation model.
Step 3: Run each question multiple times with and without RAG and collect the response data (text and tokens generated). This will allow us to get a good baseline.
Comparing Amount of Text Generated
Figure 4 compares length of text generated with and without RAG. Given the set of questions (X-axis) we compare the number of tokens (Y-axis) generated by the model with and without RAG. We repeat the same question multiple times with and without RAG and calculate the average value.
In general when using RAG we see more text is generated on average than without RAG. Although for some questions (e.g., question no. 13 and 16) the text generation is less with RAG. The two questions relate to topics which are unlikely to be found in the proprietary dataset or the training data of the model (e.g., ‘who is Azahar Machwe’). Question 17 shows a big difference in size given that one of the posts in my blog relates directly to the question.
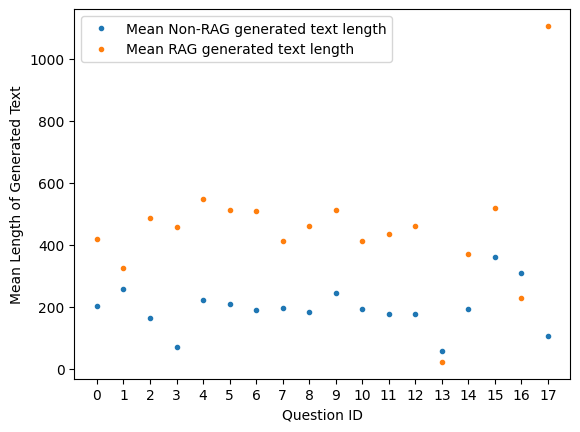
Figure 5 shows actual lengths of generated text with and without RAG. We can see with RAG the spread and skew is quite significant. For RAG the output is less spread out and the skew also appears to be less. The median for Non RAG is below the first quartile of RAG.
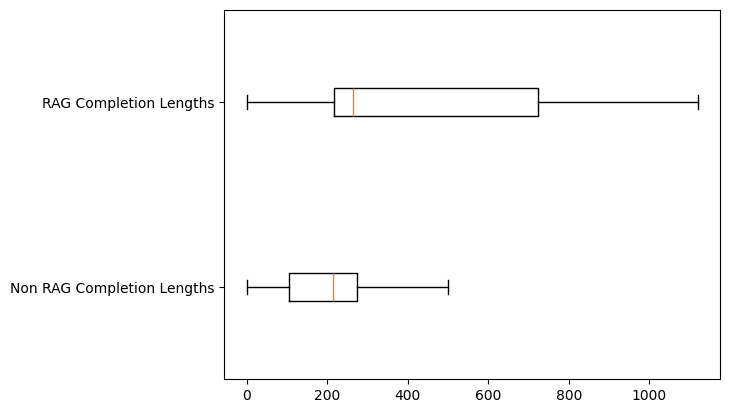
These two plots (Figure 4 and 5) show that adding proprietary data is influencing the quantity of text generated by the model.
Comparing Similarities of Output
We use the same set of questions and generate multiple responses with and without RAG. We then measure the similarity of the RAG response to the Non-RAG response. Figure 6 shows the similarities plotted against different questions.
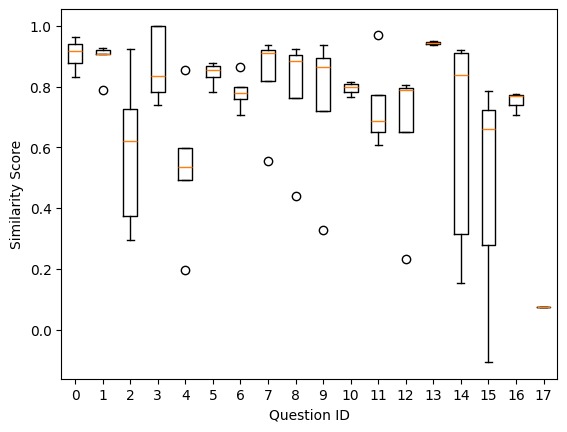
We can see a few patterns in the spread of the similarities.
- Questions 2, 14, and 15 show a large spread with a skew which suggests that the questions being asked have answers in the proprietary data as well as the training data. In this case these were technical questions about ActiveMQ, InfluxDB, and New Delhi, India.
- Questions 1, 13, and 17 show no spread and are at one end of the similarity scale.
- Question 1 and 13 show that the RAG and Non-RAG responses are similar.
- This could be because my original blog post and training data for the model were sourced from the same set of articles.
- Both my blog posts and the model had no information about it (therefore similar ‘nothing found’ responses from the model).
- Question 17 is at the other end and shows that RAG and Non-RAG responses have low similarity. This question was very specific to a blog post I wrote. Comparing it to Figure 4 we can see that the RAG response contains much more text than the Non-RAG.
- Question 1 and 13 show that the RAG and Non-RAG responses are similar.
- Questions 5, 6, 7, 8, and 9 with similarity range between 0.7 and 0.9. This points to responses that:
- Need additional scrutiny to ensure we are not depending on training data.
- Questions that need further prompt design to sample responses that give low similarity (below 0.7)
Key Takeaways
- Human scrutiny (subject matter experts, customer surveys, and customer panels) is required especially once the solution has been deployed to ensure we evaluate the prompt design, vectorisation strategy, and model performance.
- We should build a corpus of questions consisting of relevant, irrelevant, and purely nonsense (e.g., prompt attack) questions and keep updating it whilst the application is in production. This will allow us to evaluate new models, vectorisation strategies, and prompt designs. There are some examples where models are used to generate the initial corpus where no prior examples are available.
- Attempt to get separation between RAG and Non-RAG response in terms of similarity and amount of text generated. Fold in human scrutiny with this.

