Numbers are really beautiful and can often illuminate hidden corners of a complex situation. But before we start, I want to congratulate the citizens of India on an amazing election during record breaking heatwaves.
The results was a transition from Modi 2.0 to NDA 3.0 (previous two being under Mr Vajpayee) with BJP emerging as the single largest party but falling short of an absolute majority by about 32 seats.
In many ways this is a good situation that BJP is on relatively solid ground to be able to support the coalition with clear dependency on its other members to encourage more consultative approach to governance.
Back to the numbers…
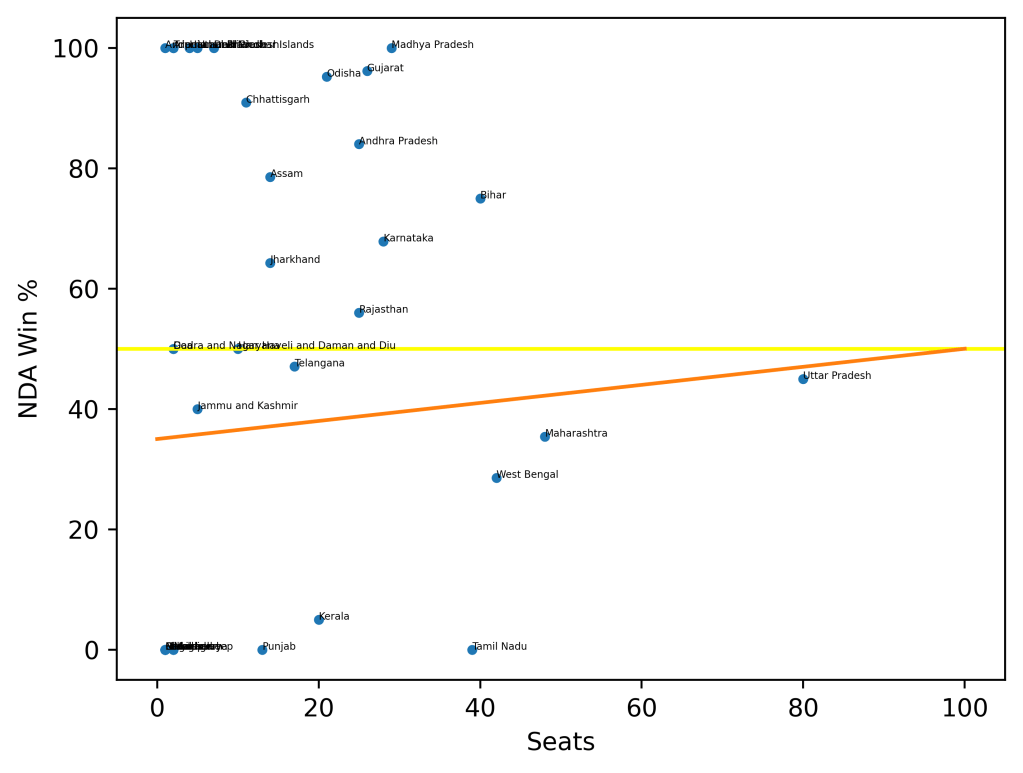
I only want to show one graph to help explain why we have the given situation. Figure 1 above shows total seats in a State against the win % (in terms of number of seats won by the BJP).
To get absolute majority the states below the orange line had to be much closer to it or in case of Uttar Pradesh, above it.
What didn’t help was the fact that states in the centre and right (those with larger number of seats in the Parliament) ended up below the yellow line (50% seat win line).
The states below or on the yellow line but above the orange line needed to be above the yellow line. For example, this time BJP lost one seat in Jammu and Kashmir – which took the win % below the 50% line (2 out of 5 seats) but still kept it above the orange line (lower envelope).
I want to add one more piece of information to the graph. The trend in voter turnout. In Figure 2 (below) we see that the red marked states (voter turnout was lower than in 2019) are mostly above the 50% win rate (yellow) line. Those below the orange line are mostly green (voter turnout higher than 2019).
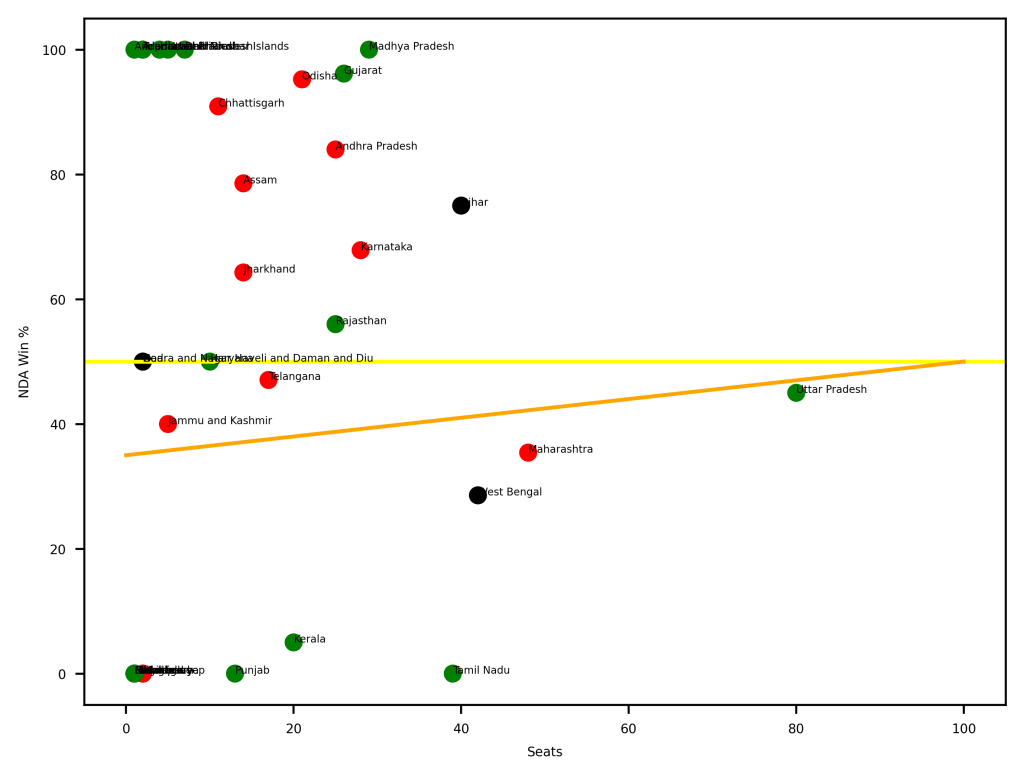
My first hypothesis is that BJP voters were far more resilient and enthusiastic about voting.
My second hypothesis is that those supporting non-BJP candidates were not convinced about their chances in front of the shock and awe campaign undertaken by the BJP.
