Bristol City Council (BCC) is now publishing some of their data sets online as part of the Open Data initiative.
This is a VERY positive move and I too hope that this leads to the development of ‘new’ solutions to the city’s problems.
More information can be found here: https://opendata.bristol.gov.uk
The Tableau Viz below uses the Quality of Life Indicators data from across Bristol. This is available from the BCC website. The data set has a set of questions (about 540) asked across the different wards in Bristol (about 35) on a yearly basis starting from 2005 till 2013. Obviously data is not available across all the dimensions, for example the question:
“% respondents who travel for shopping by bus” for the Redland ward is available only from 2006-2010.
The raw data from the Open Data website was processed using Apache Spark’s Java Libraries. This was then dumped into a data file which was imported into Tableau.
Link: Dashboard
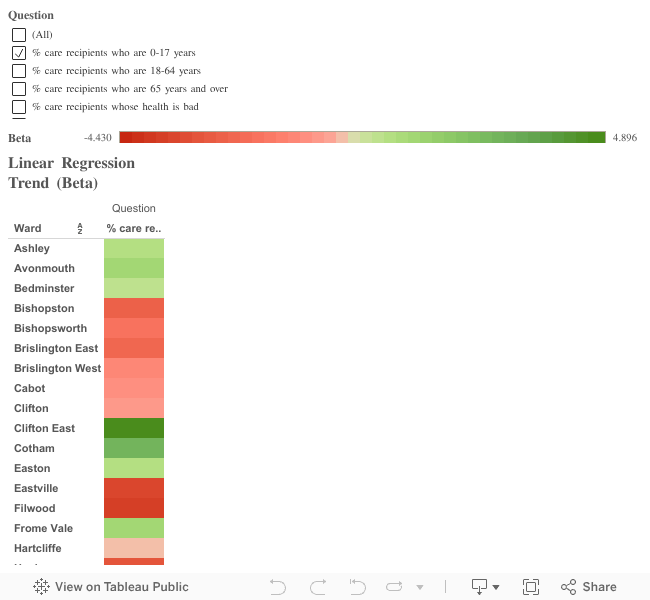
The heat map below plots the regression slope of the survey results over the years (beta) against the Questions and Wards.
Criteria for beta calculation: minimum three years data should be available.
https://public.tableau.com/javascripts/api/viz_v1.js