https://public.tableau.com/javascripts/api/viz_v1.jsThis visualisation operates upon a reduced set of questions from the Quality of Life indicators. This data has been provided by the Bristol City Council under the open data initiative (https://opendata.bristol.gov.uk/).
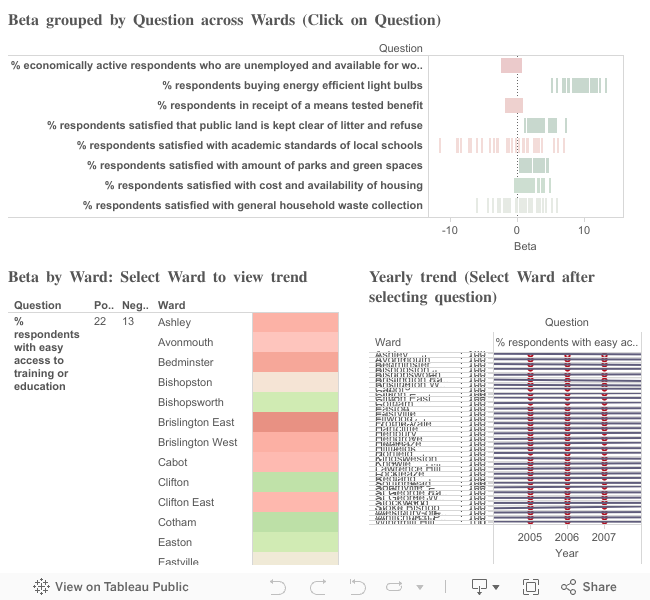
Using this view the reduced question set can be examined across all the wards as an average of beta for particular question across all wards in Bristol.
Click on a question to focus on it and to examine the beta value across all the wards. A count of wards with positive and negative beta values is also shown. These should correspond to the total green/red marks seen.
The click on a ward to examine the response over time and see the trend line (associated with beta).
Java and Apache Spark used to generate the csv data files.
Link: Dashboard
Criteria for beta calculation: minimum three years data should be available.
Reduced Question Set:
[codesyntax lang=”email”]
% respondents who usually buy fairtrade foods
% people in employment
% respondents book tickets online
Liveability indicator
% respondents who have problem from fly posting
% respondents who are carers 50 plus hours per week
% respondents who have chosen locally grown food to tackle climate change
% respondents who were victims of crime and reported  to the police
% respondents who have used the local tip or household recyling centre
% respondents in receipt of a means tested benefit
% respondents who say there is a problem withdrug dealing in their neighbourhood(includes does not apply/don't know)
% respondents who have been discriminated against or harassed because of ethnicity/race
% respondents who sometimes buy or consume locally grown food
% respondents satisfied with the availability of council/housing association housing
% respondents who are overweight and obese
% who agree that a directly elected mayor is improving the leadership of the city
% respondents who think that the appearance of their area has got better in the last two years
% respondents with problem of cars blocking local pavement
% respondents who find it difficult to get by financially
% respondents who feel locally, antisocial behaviour is a problem
% respondents who think shops have got better in the last two years
% respondents who think schools have got worse in the last two years
% respondents who disagree that the council provides value for money
% respondents who don't have the internet at home
% respondents who are underweight
% respondents who use internet banking
% respondents who agree they can influence decisions that affect public services they use
% respondents unable to use the internet
% respondents who apply for Council or Government services online
% respondents satisfied with the local tip or household recycling centre
% respondents who think drug misuse and drug dealing has got worse in the last two years
% respondents whose combined energy bill per quarter is £300-£399
% respondents satisfied that open public land is kept clear of litter and refuse
% respondents with a problem of abandoned supermarket trolleys in their neighbourhood
% respondents who feel they belong to neighbourhood
% respondents who took 3 or more return long haul flights in the past year
% respondents who are satisfied with the state of repair of their home
% respondents who have a car or van available for use by them or members of the household
% respondents who have volunteered for charity or community every month
% respondents who sometimes buy fairtrade foods
% respondents who say street litter is a problem
% respondents satisfied with their job
% respondents with easy access to a doctor
% respondents satisfied that public land is kept clear of litter and refuse
% economically active respondents who are unemployed and available for work
% respondents who did not take any return long haul flights in the past year
% respondents who have been discriminated against or harassed because of sexual orientation
% respondents who use a public computer
% respondents with parking issues
% respondents satisfied with amount of parks and green spaces
% respondents who live in council or housing association accommodation
% respondents who agree that people take responsibility for their children
% respondents who have been a victims of crime in the last 12 months
% respondents who cook at home using fresh and raw ingredients
% respondents who don't use dental services
% respondents who say graffiti is a problem
% respondents who have volunteered for charity or community at least once a month
% respondents with no educational or technical qualifications
% respondents who have problem from fly tipping
% respondents keen to learn the internet
% respondents who use the internet at work
% respondents who think shops have got worse in the last two years
% respondents who feel safe when outside in their neighbourhood after dark
% respondents who live in rented or tied accommodation
% respondents satisfied with the maintenance of footpaths

% respondents who have been discriminated against or harassed because of religion

% respondents who use the internet at home

% respondents who search the internet

% respondents who say discarded needles and syringes are a problem in their neighbourhood

% respondents who have noise from industrial commercial or construction sites

% respondents who smoke

% respondents who think parks and public spaces has got worse in the last two years
% respondents who think the area they live in will be better in five years time

% who feel police and local public services are successfully dealing with issues of crime and anti-social behaviour in their area
% respondents who are obese
% respondents who have someone use the internet for them
% respondents who think their area is a good place to bring up children
% respondents who use NHS dental services
% of respondents who have access to the internet and use it
% respondents who use digital technology to create content

% respondents who took 2 return long haul flights in the past year

% respondents satisfied with cost and availability of housing
% respondents who have their own garden
% respondents who say traffic congestion is a problem in their neighbourhood
% respondents who have been discriminated against or harassed because of gender
% respondents who shop online
% respondents who usually buy or consume locally grown food
% respondents who agree sexual harassment is an issue in Bristol
% respondents who have been discriminated against or harassed because of age
% respondents who say drug dealing is a problem in their neighbourhood
% respondents who think drunk and rowdy people in public places is a problem
% respondents who think job opportunities has got worse in the last two years
% respondents who use the internet when out and about
% respondents satisfied with jobs in the neighbourhood
% respondents who agree ethnic differences are respected in their neighbourhood
% respondents happy using the internet
% respondents who say drug dealing is a serious problem in their neighbourhood.
% respondents who agree that people treat other people with respect in their neighbourhood
% respondents who eat home cooked 4 times a week
% respondents unemployed
% respondents satisfied with the bus service
% respondents who feel safe when outside their neighbourhood during the day
% respondents satisfied with  local tips / household recycling centres
% respondents who say vandalism is a problem in their neighbourhood
% respondents who say personal safety is a problem in their neighbourhood
% who live in owned private or tied accommodation
% respondents who think drug misuse and drug dealing has got got better in the last two years
% respondents who live in households with a smoker
% respondents who think antisocial behaviour has got got better in the last two years
% respondents who think antisocial behaviour has got worse in the last two years
% respondents who code
% respondents who are dissatisfied with the way the council runs things
% respondents who say they have problem with personal safety in their neighbourhood(includes does not apply/don't know)
% respondents who feel safe indoors after dark
% respondents not interested in using the internet
% respondents who own their own homes
% respondents who eat food grown by themselves or by people they know
% respondents satisfied with academic standards of local schools
% respondents satisfied with markets
% respondents who have access to the internet
% respondents who took 1 return short haul flight in the past year
% respondents who have been discriminated against or harassed because of disability
% respondents who are satisfied with the way the council runs things
% respondents who took 1 return long haul flight in the past year
% respondents who say insensitive development is a problem in their neighbourhood
% respondents with easy access to childcare (adult survey)
% respondents satisfied with leisure facilities/services for children under 12 (adult survey)
% respondents satisfied with libraries
% respondents with easy access to training or education
% respondents who did not take any return short haul flights in the past year
% respondents satisfied with neighbourhood
% respondents who feel dog fouling is a problem in local area
% respondents who took 3 or more return short haul flights in the past year
% respondents who have noise from neighbours
% respondents who feel crime has got worse over last 3 years
% respondents who say neglected or derelict buildings or land is a problem in their neighbourhood
% respondents who think their neighbourhood has got worse over the last 2 years
% respondents who think job opportunities has got got better in the last two years
% respondents who say their neighbourhood is getting better
% respondents with noise from fireworks
% respondents who think the police and council succesfully respond to anti-social behaviour
% respondents who can't afford the internet
% respondents who are willing to call themselves disabled
% respondents who live in households with someone who smokes regularly within the home
% respondents whose combined energy bill per quarter is £400 or more
% respondents satisfied with health services
% respondents who agree people from different backgrounds get on well together
% respondents who don't have a garden or allotment
% respondents buying energy efficient light bulbs
% respondents satisfied with general household waste collection
% respondents who think drug use is a problem in their area
[/codesyntax]
https://public.tableau.com/javascripts/api/viz_v1.js