Delhi suffers from an annual dengue epidemic between the months of July and October. It is only the cooler and drier weather at the start of November that stops the mosquitoes that spread this disease.
The year 2015 was a bad year for dengue and all kinds of records were broken. Thankfully due to increased awareness the death toll did not set any records. In fact it was not as high as it could have been (in my view even 1 death is high!).
So I wanted to try and see if there is a relation between Rainfall and Dengue cases?
Also to see if there is any way of predicting the number of Dengue cases in 2016?
I used the historic data available from: http://nvbdcp.gov.in/den-cd.html
and MCD (Delhi).
Data
Year, Rainfall, Cases
2006, 618.70, 3340
2007, 601.60, 548
2008, 815.00, 1216
2009, 595.50, 1154
2010, 953.10, 6259
2011, 661.80, 1131
2012, 559.40, 2093
2013, 1531.40, 5574
2014, 778.60, 995
2015, 1123.10, 15836
Rainfall vs Dengue
More rain – more water logging leading to more opportunities for mosquitoes to multiply. Therefore there must be some relationship between Rainfall and the number of Dengue cases. Given the dramatic growth of Delhi over the last five years we restrict going as far back as 2010.
Using the available data for rainfall and dengue cases if we fit a straight line and 2nd degree polynomial we get Diagram 1 below.
 Diagram 1: Rainfall vs Dengue Cases.
We see that for a linear model there is a clear trend of higher number of cases with increasing rainfall. The R-Square value is 0.35 (approx) which is not a good fit but it is expected given the fluctuations.
What is more interesting is the 2nd degree polynomial which gives a R-Square value of 0.94 (approx) which is very good. But this could also point to over-fitting.
Another way of interpreting it is that there is a ‘sweet-spot’ for dengue spreading rapidly. If the rain is below a certain amount – there is not enough water around for dengue vector (mosquito) to breed. If there is too much rain then also there is lack of ‘still’ water to allow mosquitoes to breed.
The ‘sweet spot’ seems to be rain at a certain level that tapers leaving enough amount of ‘stagnant’ water for mosquitoes to breed.
Growth of Dengue over the Years
Diagram 2 shows the growth trend of Dengue over the years. In 1996 the dengue epidemic broke all records. In 2015 it broke all records once again. If we were to plot the number of cases over the years we see that the graph is steadily marching upwards.
If all other factors remain constant we should see about 6000 cases in 2016.
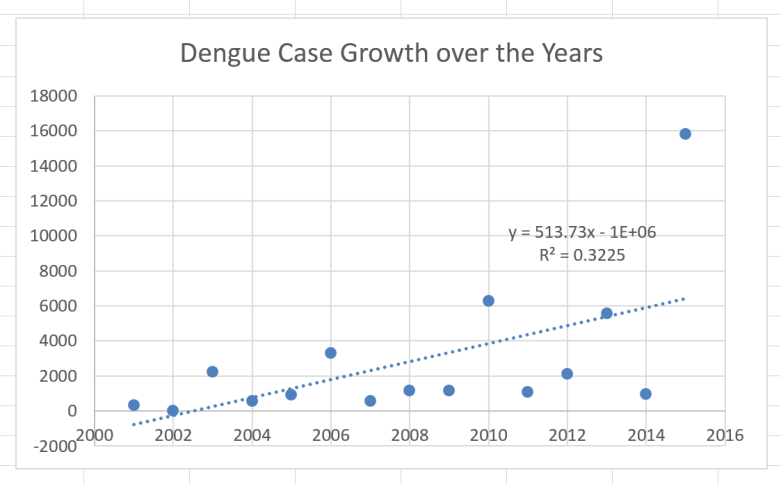
Diagram 2: Dengue growth rate over the years.
This is a very simple analysis of dengue. There are lots of other variables that can be added (for example – growing population, temperature profiles, regional variance). But I wanted to show how even simple analysis can produce some interesting results.
Another important point I wanted to highlight was the lack of easily accessible data on diseases and epidemics. If we had better data then public health initiatives could be better targeted to combat such occurrences.
