I have been collecting currency data (once every hour) over the last couple of years, using a Node.JS retriever. The data goes in to a Mongo DB instance. We store the timestamp and all the currency pairings against the US Dollar (e.g. how may GBPs get you 1 USD).
Some other features we may need:
- What if we want different pairings? Say we wanted to have pairings against Gold or Euros?
- We may need to normalise the data if we want to compare the movement of different currencies?
- We may also need ways of visualising the data (as time series etc.)
To cater to this I decided to bring in Grafana (I did not want to use the ELK stack because I believe if you don’t need text search don’t use elasticSEARCH!). Grafana does not support Mongo out of the box so I had to bring in Influx DB.
Bringing in Influx DB allowed me to integrate painlessly with Grafana (sort of). But as we all know – when you are integrating systems there is a certain minimum amount of pain you have to experience. Juggling around just shifts that pain to hopefully a location where you can deal with it efficiently. I my case I moved the pain to the integration between Mongo and Influx.
I had to create a component that pulls out the raw data from Mongo DB, pumps it through a pipeline to filter (to get the pairings of interest – the full data set has 168 currencies in it!), normalise and inject into Influx DB.
A side note: I used the Influx DB Java API which was REALLY easy to use, this encouraged me to go ahead with the Influx – Mongo integration in Java.
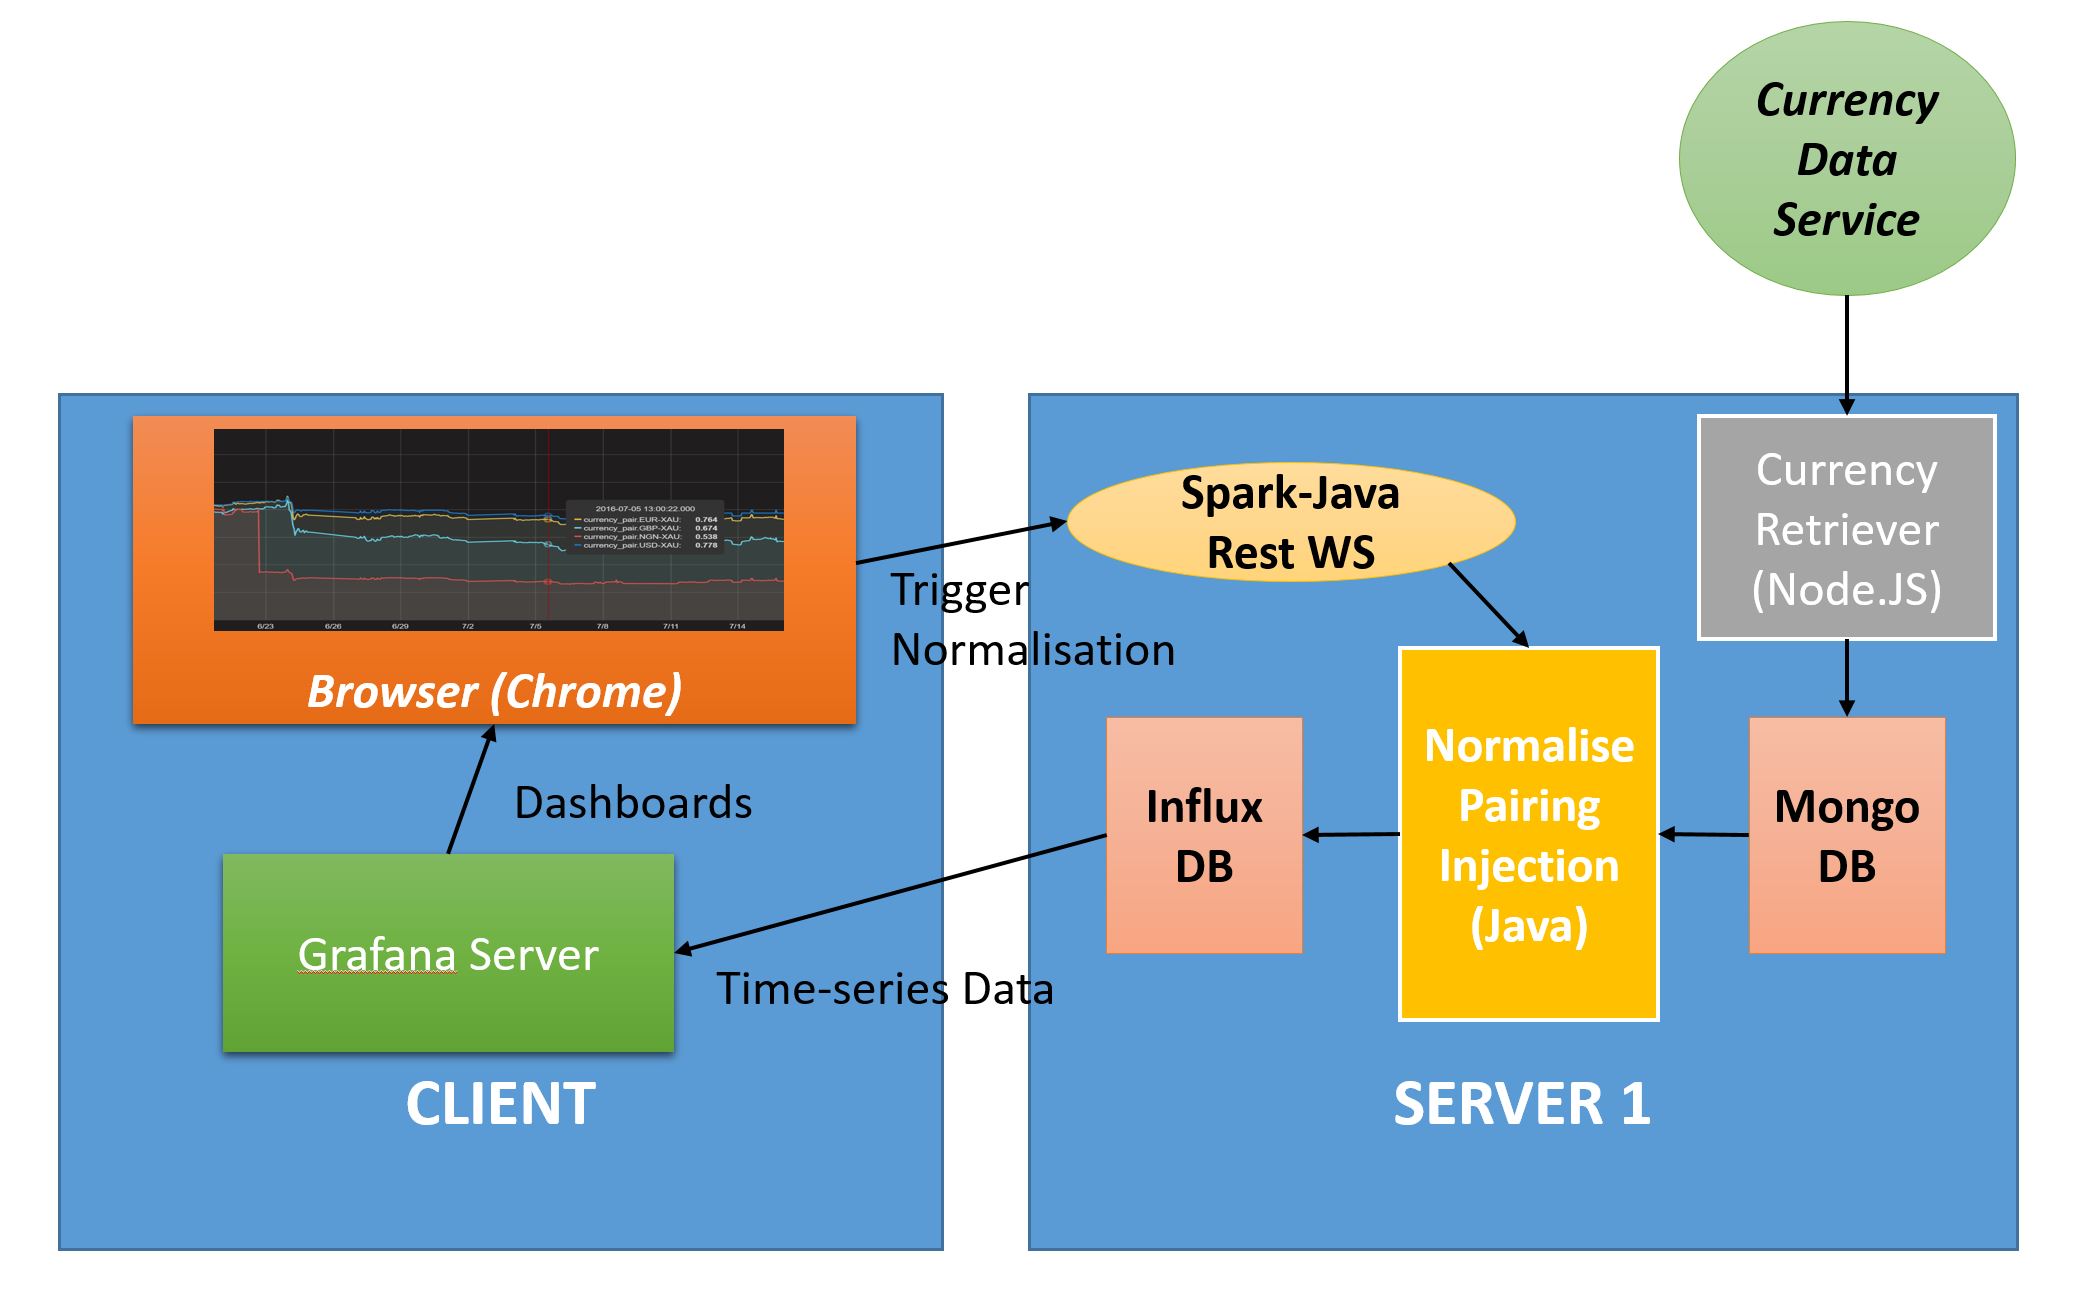
I also wanted the Influx – Mongo integration to be ‘on-demand’ so that we can create different pairings against different targets – such as the big 3 against Gold, major currencies against SDR (International Monetary Fund – Special Drawing Rights) etc. and populate different time-series databases in Influx. So I gave the integration a REST interface using Spark-Java.
I did encounter one problem with Grafana – InfluxDB integration was the ‘easy’ query system did not work – I had to create one manually – which is pretty straight forward as the InfluxDB documentation is decent.
Results
I was able to get the dashboards to work with normalised time-series of 6 currencies against Gold (XAU): US Dollar (USD), Indian Rupee (INR), Nigerian Naira (NGN), Euro (EUR), British Pound (GBP) and Chinese Yuan (CNY). I discovered something interesting when I was looking at the data around the ‘Brexit’ vote (23/24 June 2016).

The screenshot above is from Grafana. Filtered to show EUR-XAU, GBP-XAU, USD-XAU and NGN-XAU. We see a massive dip in Nigerian Naira before the actual Brexit vote. I was surprised so I googled and it seems that few days before Brexit vote the Naira was allowed to float against USD (earlier it was pegged to it) which led to a massive devaluation.
Then on Brexit day we see a general trend for the selected currencies to fall against Gold as it suddenly became the asset of choice once the ‘unthinkable’ had happened, with the GBP-XAU registering the largest fall. As you can see the Naira also registers a dip against Gold (XAU).
This also shows how universal Gold is. At one time all currencies were pegged against Gold, now unofficially USD is the currency of trade, but this shows when something unthinkable or truly ‘world-changing’ happens people run back to the safety of Gold.

2 Comments