The code (Scala+Maven) can be found here: https://github.com/amachwe/Scala-Machine-Learning
The idea is simple… I found an open Geo data (points) set provided by Microsoft (~24 million points). The data is NOT uniformly distributed across the world, in fact the data is highly skewed and there are large concentrations of location data around China (Beijing specifically) and the US (West-Coast).
The data can be found here: https://www.microsoft.com/en-us/download/details.aspx?id=52367
As per the description:
This GPS trajectory dataset was collected in (Microsoft Research Asia) Geolife project by 182 users in a period of over three years (from April 2007 to August 2012). Last published: August 9, 2012.
Loading the Data:
The data set is fairly simple, it contains longitude, latitude, altitude and time-date information. All the details are available with the data set (being Microsoft they have complicated matters by creating a very complex folder structure – but my GeoTrailsLoader Object makes easy work of traversing and loading the data into Mongo ready for you to play around with it.
The data is loaded as Points (WGS 84) and indexed using a 2dSphere. Once the data is in Mongo you can easily test the ‘geographic’ nature of it by running a geo-query:
[codesyntax lang=”javascript”]
{
  $near: {
     $geometry: {
        type: "Point" ,
        coordinates: [ <longitude> , <latitude> ]
     }
  }
}
[/codesyntax]
More Query types here: https://docs.mongodb.com/v3.2/applications/geospatial-indexes/
Clustering the Data:
The ScalaWorker does the K-Means training on the geo-data within Mongo using Spark and the Mongo-Spark connector.
We use a local Spark instance (standalone) but you can just as easily use a Spark cluster if you are lucky enough to have access to multiple machines. Just provide the IP Address and Port of your Spark master instead of ‘local[*]’ in the ‘setMaster’ call.
In the example the data is loaded from Mongo into RDDs and then we initiate K-Means clustering on it with a cluster count of 2000. We use Spark ML Lib for this. Only the longitude and latitude are used for clustering (so we have a simple 2D clustering problem).
The clustering operation takes between 2 to 3 hrs on a i7 (6th Gen), 16GB RAM, 7200RPM HDD.
One way of making this work on a ‘lighter’ machine is to limit the amount of data used for K-Means. If you run it with a small data set (say 1 million) then the operation on my machine just takes a 10-15 mins.
Feel free to play around with the code!
The Results:
The simple 2D cluster centres obtained as a result of the K-Means clustering are nothing but longitudes and latitudes. They represent ‘centre points’ of all the locations present in the data set.
We should expect the centres to be around high concentration of location data.
Furthermore a high concentration of location data implies a ‘popular’ location.
As these cluster centres are nothing but longitudes and latitudes let us plot them on the world map to see what are the popular centres of location data contained within the data set.
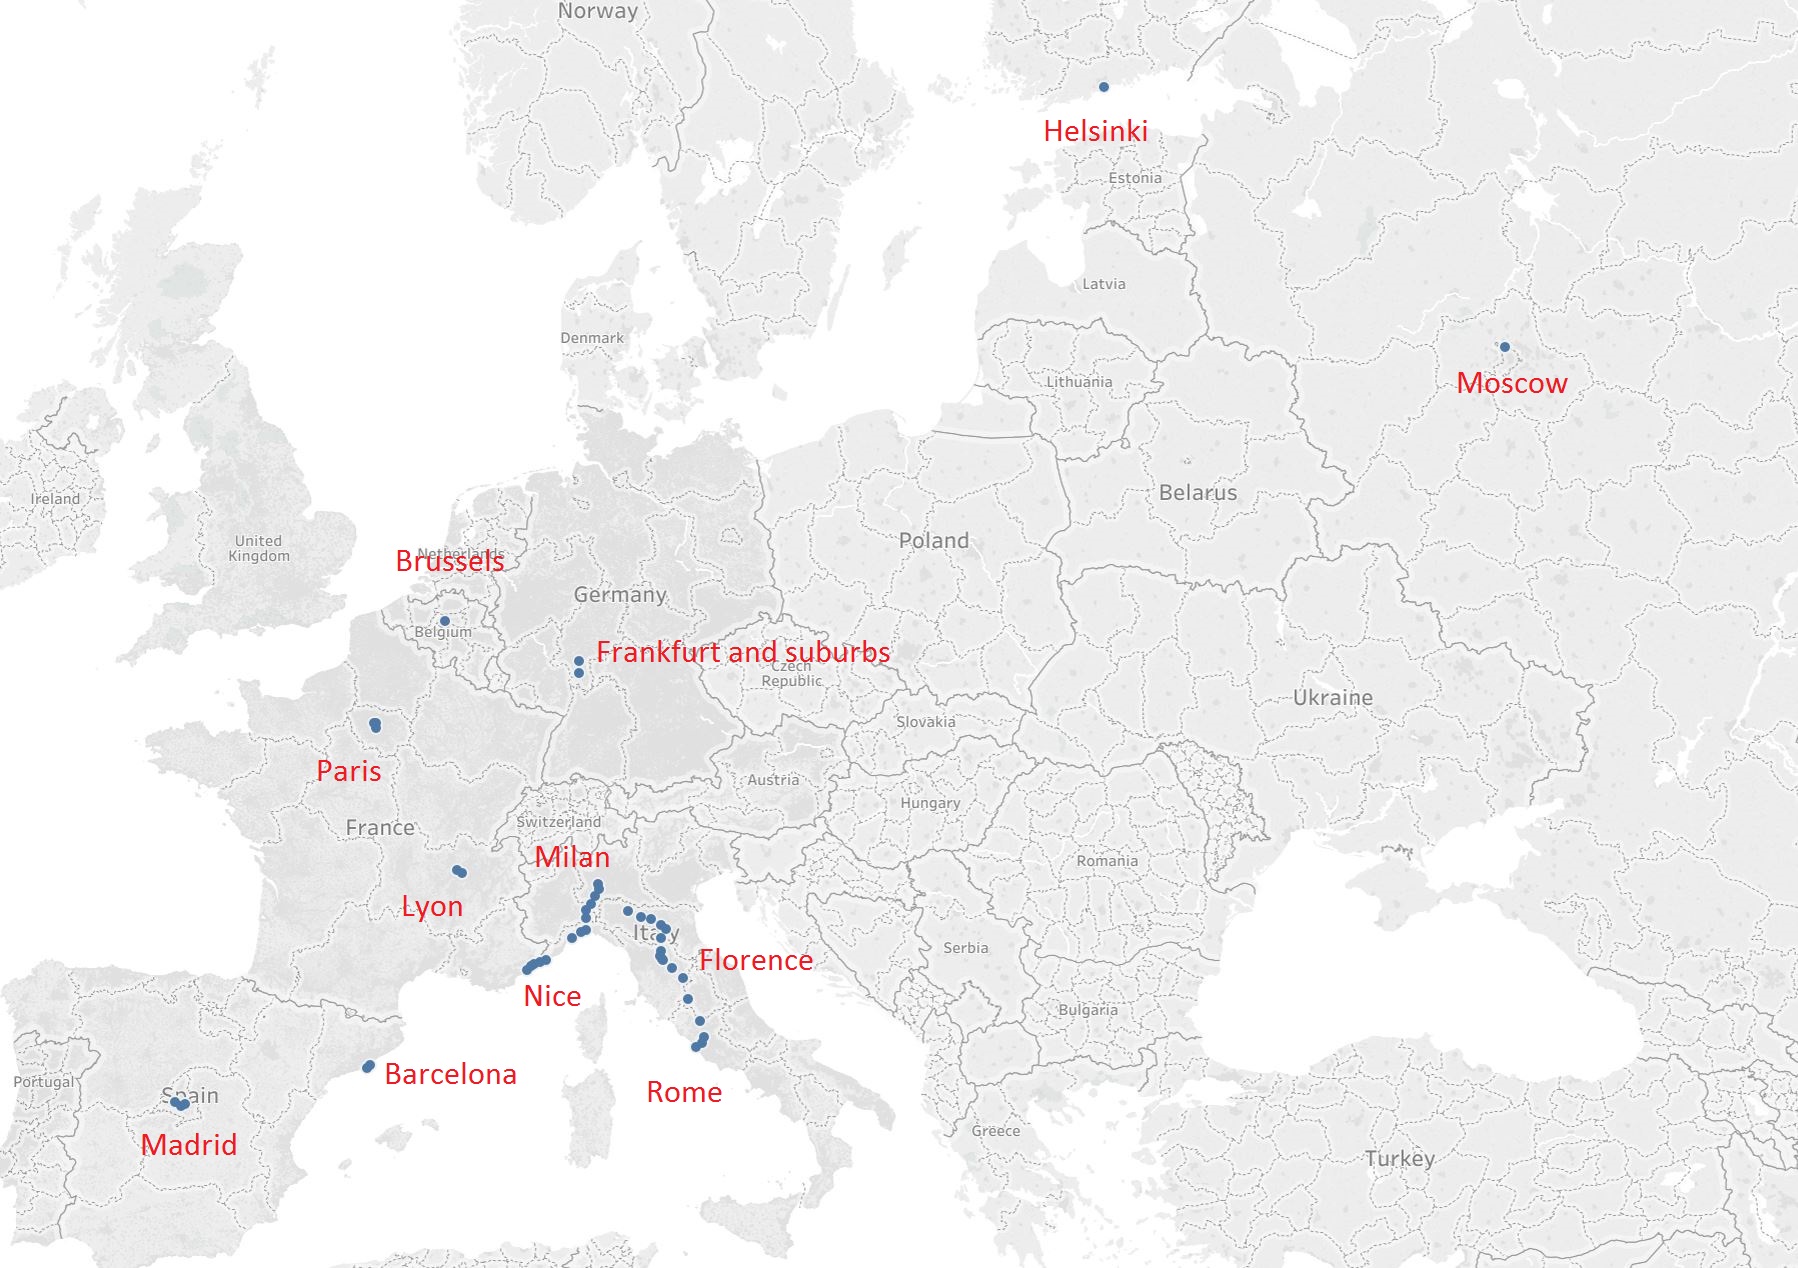
The image above is a ‘zoomed’ plot of the cluster centres (blue dots). I chose an area with relatively fewer cluster centres to make sure we do not get influenced by the highly skewed data set.
I have provided a sample 2000 cluster centre file here: https://github.com/amachwe/Scala-Machine-Learning/blob/master/cluster_centre_example/clusters_2000.csv
The red text is the ‘popular area’ these cluster centres represent. So without knowing anything about the major cities of Eurasia we have managed to locate many of them (Paris, Madrid, Rome, Moscow etc.) just by clustering location data!
We could have obtained a lot of this ‘label’ information automatically by using a reverse geo-coding service (or geo-decoding service) where we pass the cluster centre and obtain meta-data about that location. For example for the cluster centre: 41.8963978, 12.4818856 (reversed for the geo-decoding service – in the CSV file it is: 12.4818856, 41.8963978) is the following location in Rome:
Piazza Venezia
Wikipedia describes Piazza Venezia as the ‘central hub’ of Rome.
The geo-decoding service I used (with the sample cluster centre) is: http://noc.to/geodecode#41.8963978,12.4818856
Enjoy!
