The game of tic tac toe (naughts and crosses) is a very simple yet interesting game.
If you don’t know anything about the game visit this link first: https://en.wikipedia.org/wiki/Tic-tac-toe
Some terms I will be using in this post:
- Grid – the x by x square grid used to play the game, most common size is 3 by 3
- Grid Reference – the reference to each entry (or slot) in the Grid, for a x by x grid there will be x-squared grid references, therefore for 3 by 3 there are 9 references and for 4 by 4 there are 16
- Grid Value – each grid reference (or slot) can be empty, ‘x’ or ‘o’
- Move Sequence – a complete set of moves that define a game, for a Grid Reference length of 9 (3 by 3 grid) there are Factorial(9) set of Move Sequences, a valid example of a move sequence for 3 by 3 grid:
[1, 3, 4, 6, 5, 7, 9, 8, 2] : alternate moves by player 1 and 2
Each player takes a symbol and sticks with it (‘x’ or ‘o’)In my post Player 1 always uses ‘o’ and Player 2 ‘x’, this choice has no impact on the final result
- Set of Move Sequences – a set of move sequences, these can be the full set (all possible moves) for grids of size 3 by 3 (2 by 2 is a trivial case as we shall see). As we move to larger grids the total set of possible moves increases at a Factorial rate therefore we can only sample from the full set of move sequences.
Grid size, Number of Grid Slots, Total number of moves
2x2, 4 slots, 24 move sequences
3x3, 9 slots, 362880 move sequences
4x4, 16 slots,  >20 trillion move sequences
The interesting thing about regular tic tac toe is that it is deceptively simple as a game with straight forward rules, but can throw some surprising results. The other interesting point is the one related to the rapidly exploding set of possible move sequences.
The Target
How do we analyze games, develop strategies and generally have some fun with this ‘friendly’ problem? Do the strategies remain the same as we scale up the grid?
Approach
I built a tic tac toe simulator to generate move sequences and process them to analyse the final result using Python.
I also used MatplotLib for plotting results and AnyTree for generating brute force move sequences. It is very easy to extend the code and incorporate optimum strategy results to build a tic tac toe bot.
The Python file is attached at the end of this post.
Data Collection
The process of collecting data is very simple.
A set of move sequences is generated (brute force for 3 by 3 grid will generate the complete set of move sequences) by sampling without replacement (size: 10000) from all possible move sequences.
Sampling
The sampling is carried out using a Markov Chain – starting with an initial move sequence (a list of grid references or slots – for 3 by 3 this will be [1, 2, 3, 4, 5, 6, 7, 8, 9]) we (with uniform probability) pick any two moves and switch them. Thus the next state depends only on the previous state.
As an example:
Pick the first and last move to switch.
Sequence at Step t: [1, 3, 4, 6, 5, 7, 9, 8, 2]
Sequence at Step t+1: [2, 3, 4, 6, 5, 7, 9, 8, 1]
The sample size for Grids more than 3 by 3 is 10000.
Using the sampling we can estimate the following given arbitrary grid size:
- Is there any advantage in starting first?
- How many games end in a draw or have second movers as winners?
- Which are the ‘best’ starting squares?
- How are these factors affected by grid size?
Results
I experimented with grids of size 3 by 3, 4 by 4, 5 by 5 and 6 by 6 (here we are going beyond the Age of the Universe w.r.t. number of move sequences!) and pulled out some interesting statistics!
3 by 3 Grid:
Here the first mover has a CLEAR advantage. It is not surprising because the first mover gets 5 moves as compared to the second user. But the advantage is QUITE SIGNIFICANT.
First Mover Advantage:
- The First mover wins 58.4 % of the games (using brute force: 58.492%)
- The Second mover wins 28.8% of the games (using brute force: 28.809%)
- There are 12.7% instances of a Draw (using brute force: 12.698%)
2 by 2 Grid (An Interlude)
If you are wondering about the 2 by 2 grid (and why we called it a trivial case) then try out a few simple games of 2 by 2 tic tac toe as a thought experiment. In case you are impatient the 2 by 2 grid becomes a trivial case because there is no possibility of a draw or the second mover winning. The first mover wins in all 24 move sequences! You could brute force it on a piece of paper.
3 by 3 Grid Plots
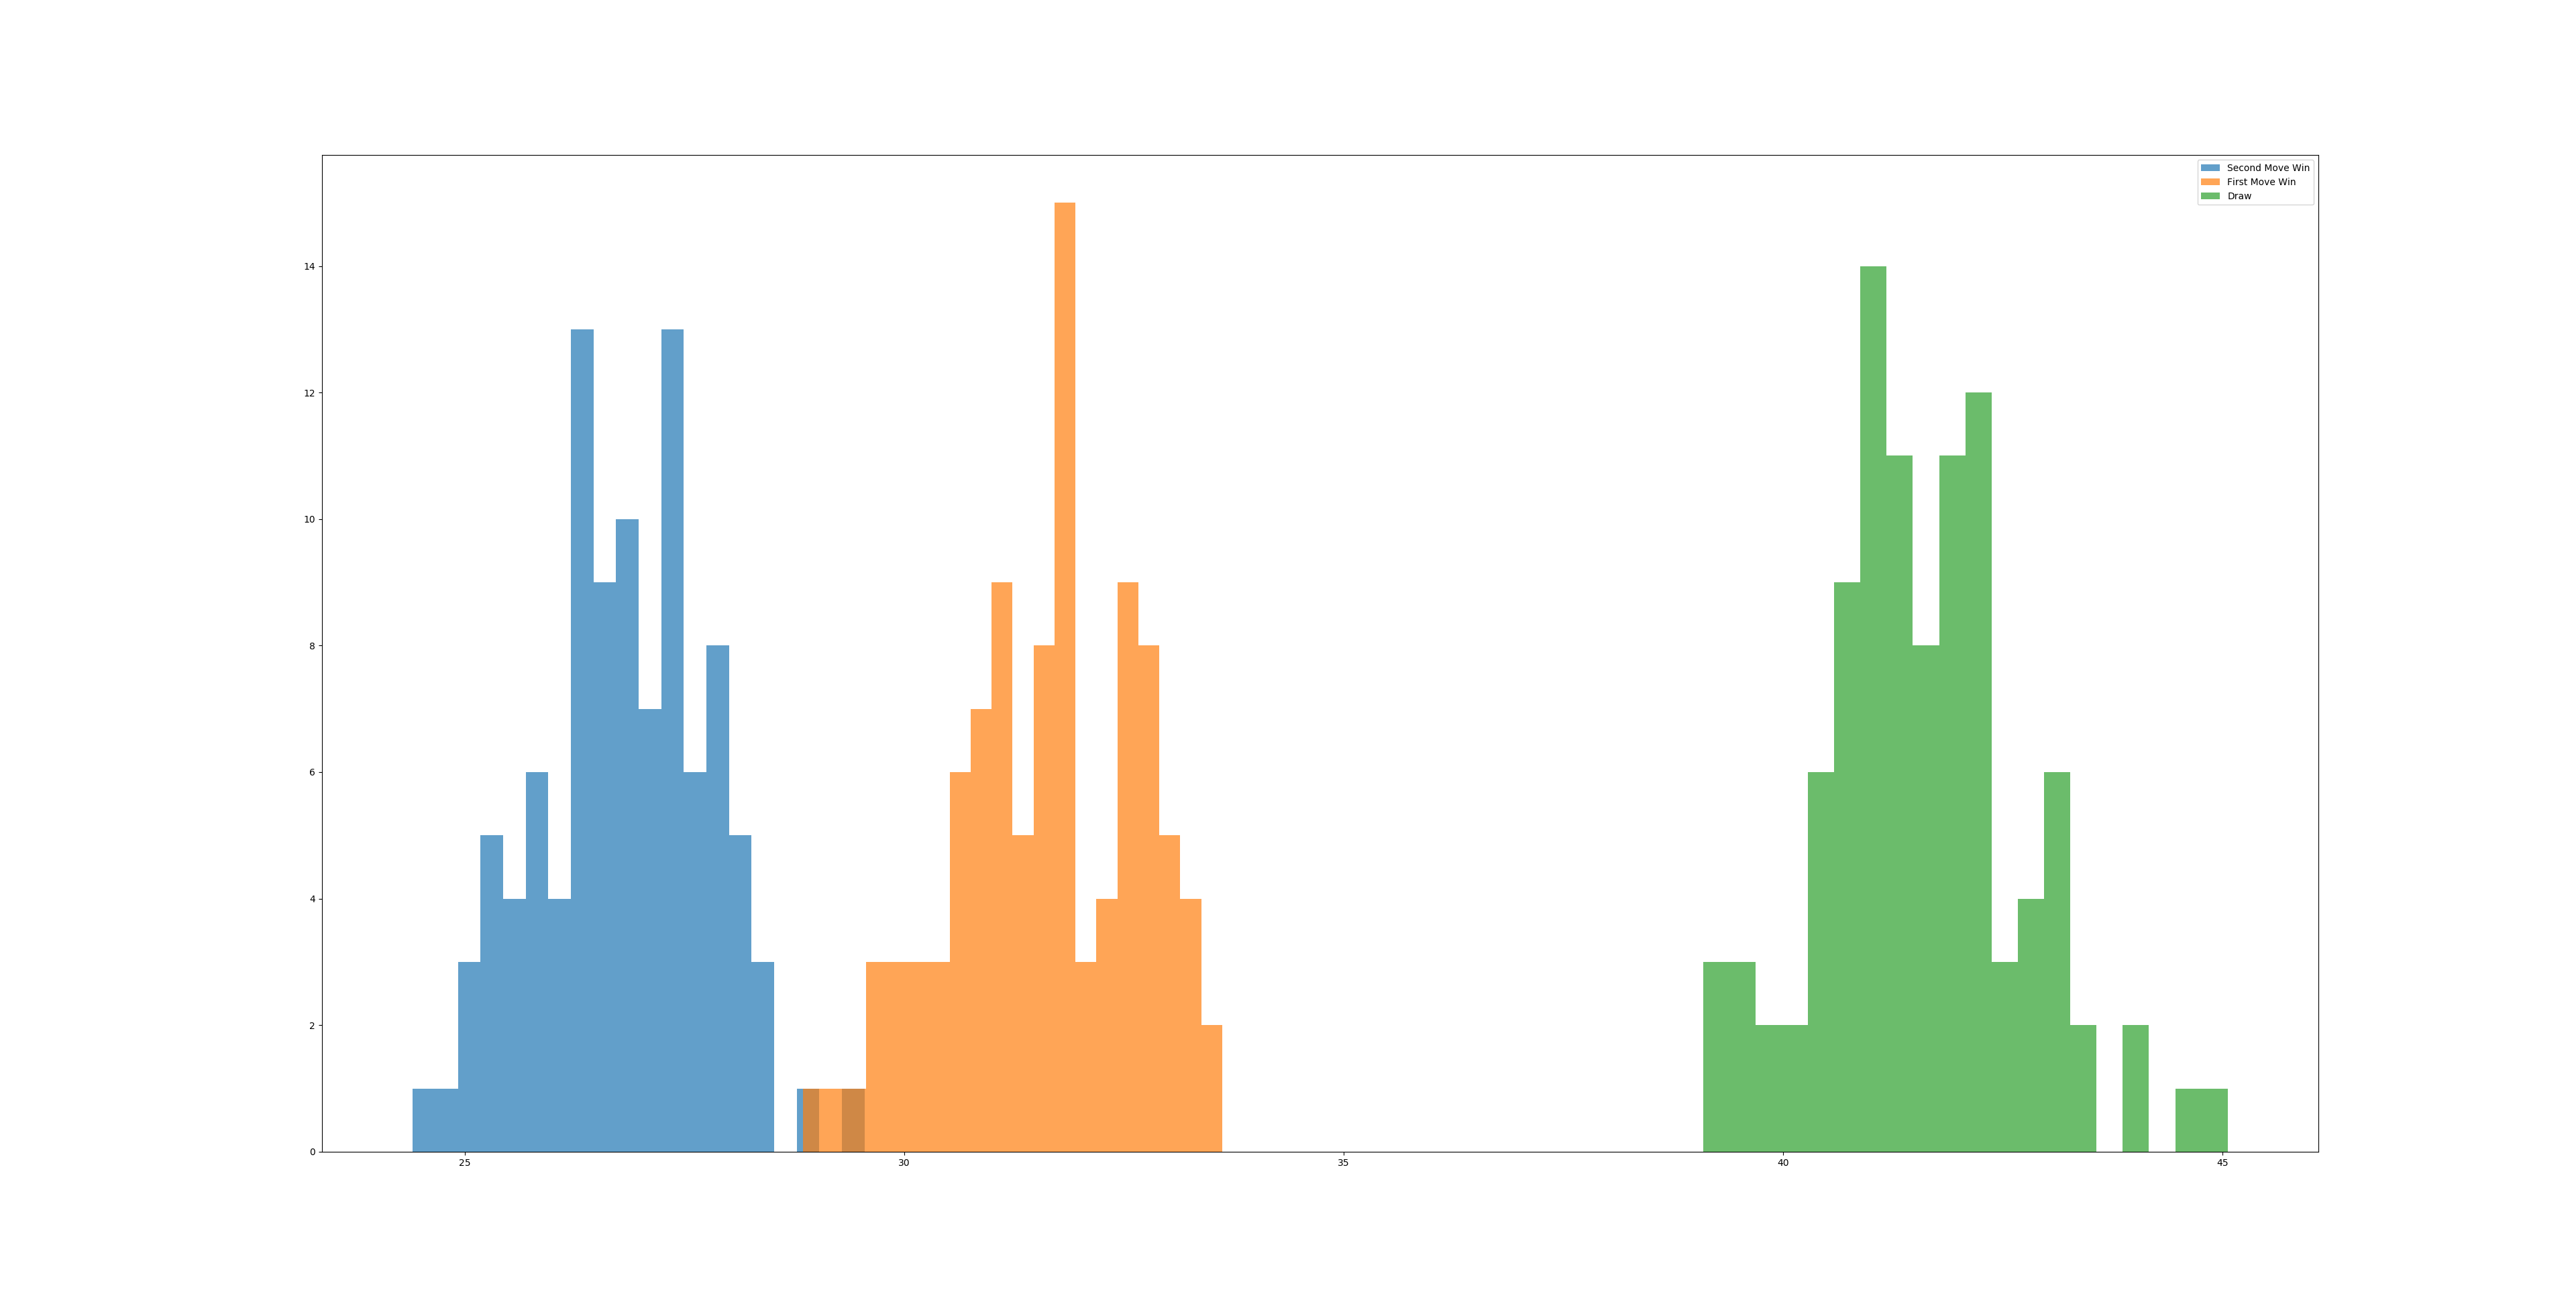
The graph below shows a 3 by 3 grid histogram of winning percentages for First Movers (Orange), Second Movers (Blue) and Draws (Green).

The above histogram clearly shows the difference between the three.
Strategy for Tic Tac Toe!
For the first movers the best starting square by far is 5 (right in the middle and opens up 4 winning lines – most of any starting square, all other squares open up to 3!). Second best option then becomes the corners (1, 3, 7, 9).
For the second movers the best starting squares are 2, 4, 6, or 8 (a diamond pattern).
4 by 4 Grid:
When we increase the size to a 4 by 4 grid we get 16 slots with > 20 trillion move sequences. It is difficult to analyse this (and probably pointless) using the brute force approach. To do this quickly we can use the sampling approach where we randomly sample move sequences (as described before) and measure how many of these lead to draws, first mover wins and second mover wins. This will obviously be an approximate measure.
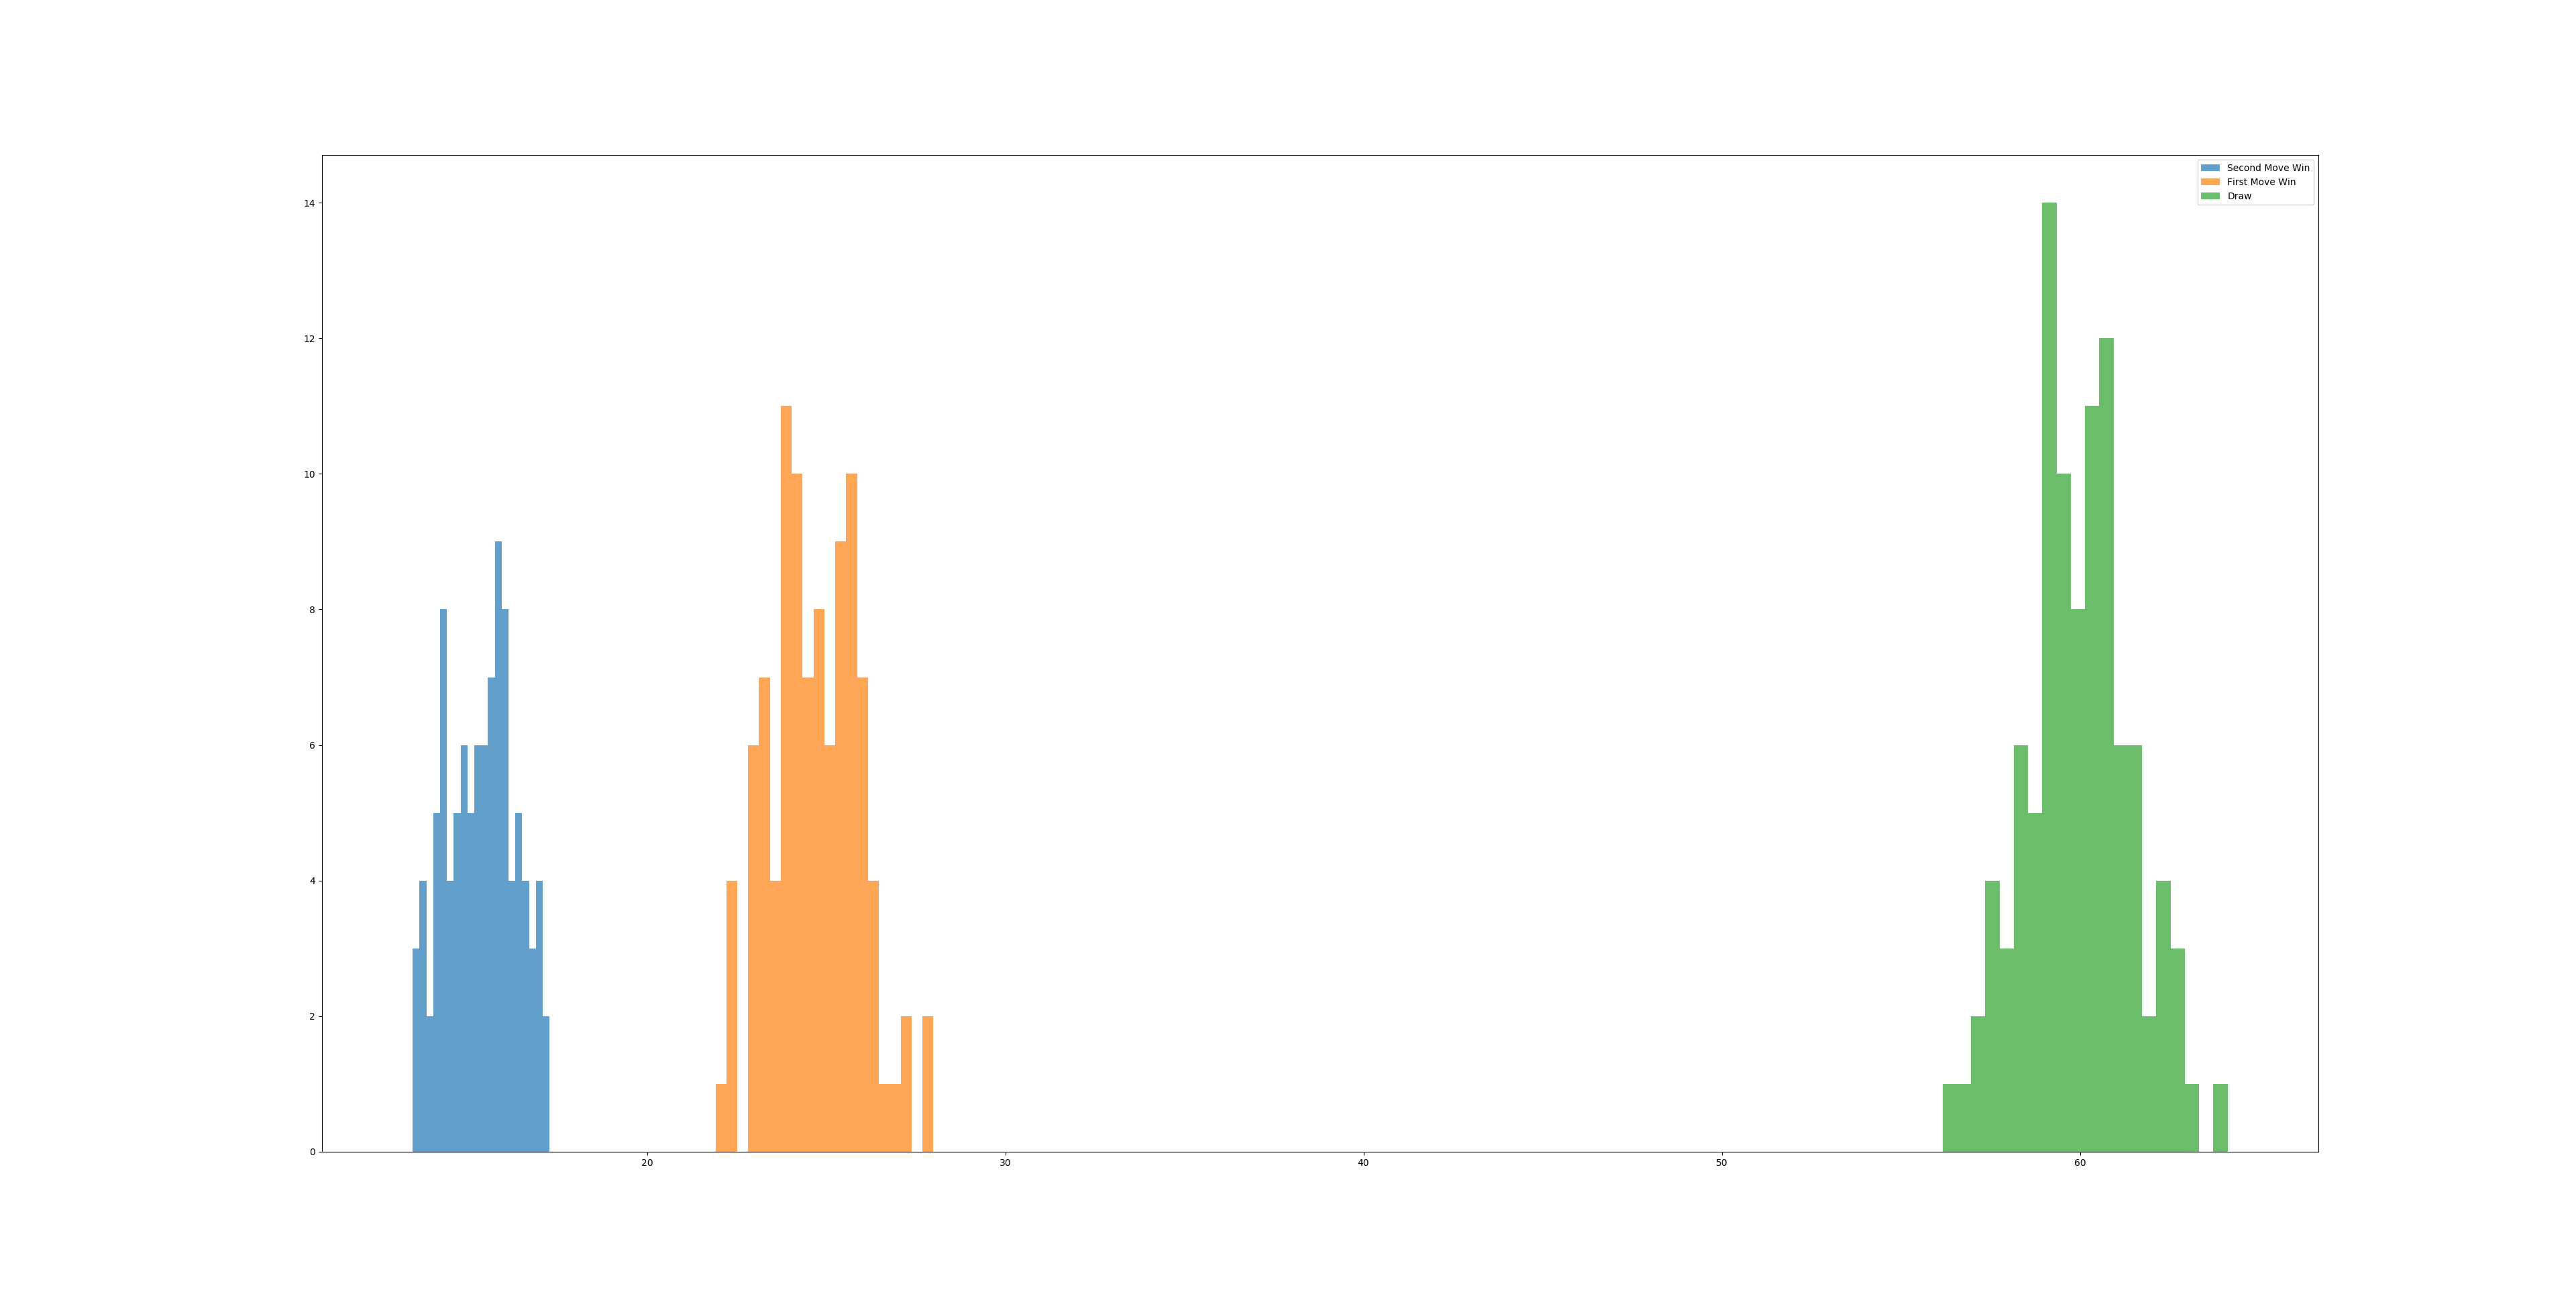
The result is presented in the histogram below. Once again First movers in Orange, Second Movers in Blue and Draws in Green.
This time we see that there is high chance of a draw (~ 42%), first movers still win more than second movers but the difference is less dramatic (~ 31% for first movers and ~ 26% for second movers). We also see that the first and second mover distributions are starting to overlap at the edges.
5 by 5 Grid:
For a larger 5 by 5 Grid it is impossible to do a brute force calculation as the full number of move sequences reach a stunning Factorial 25!
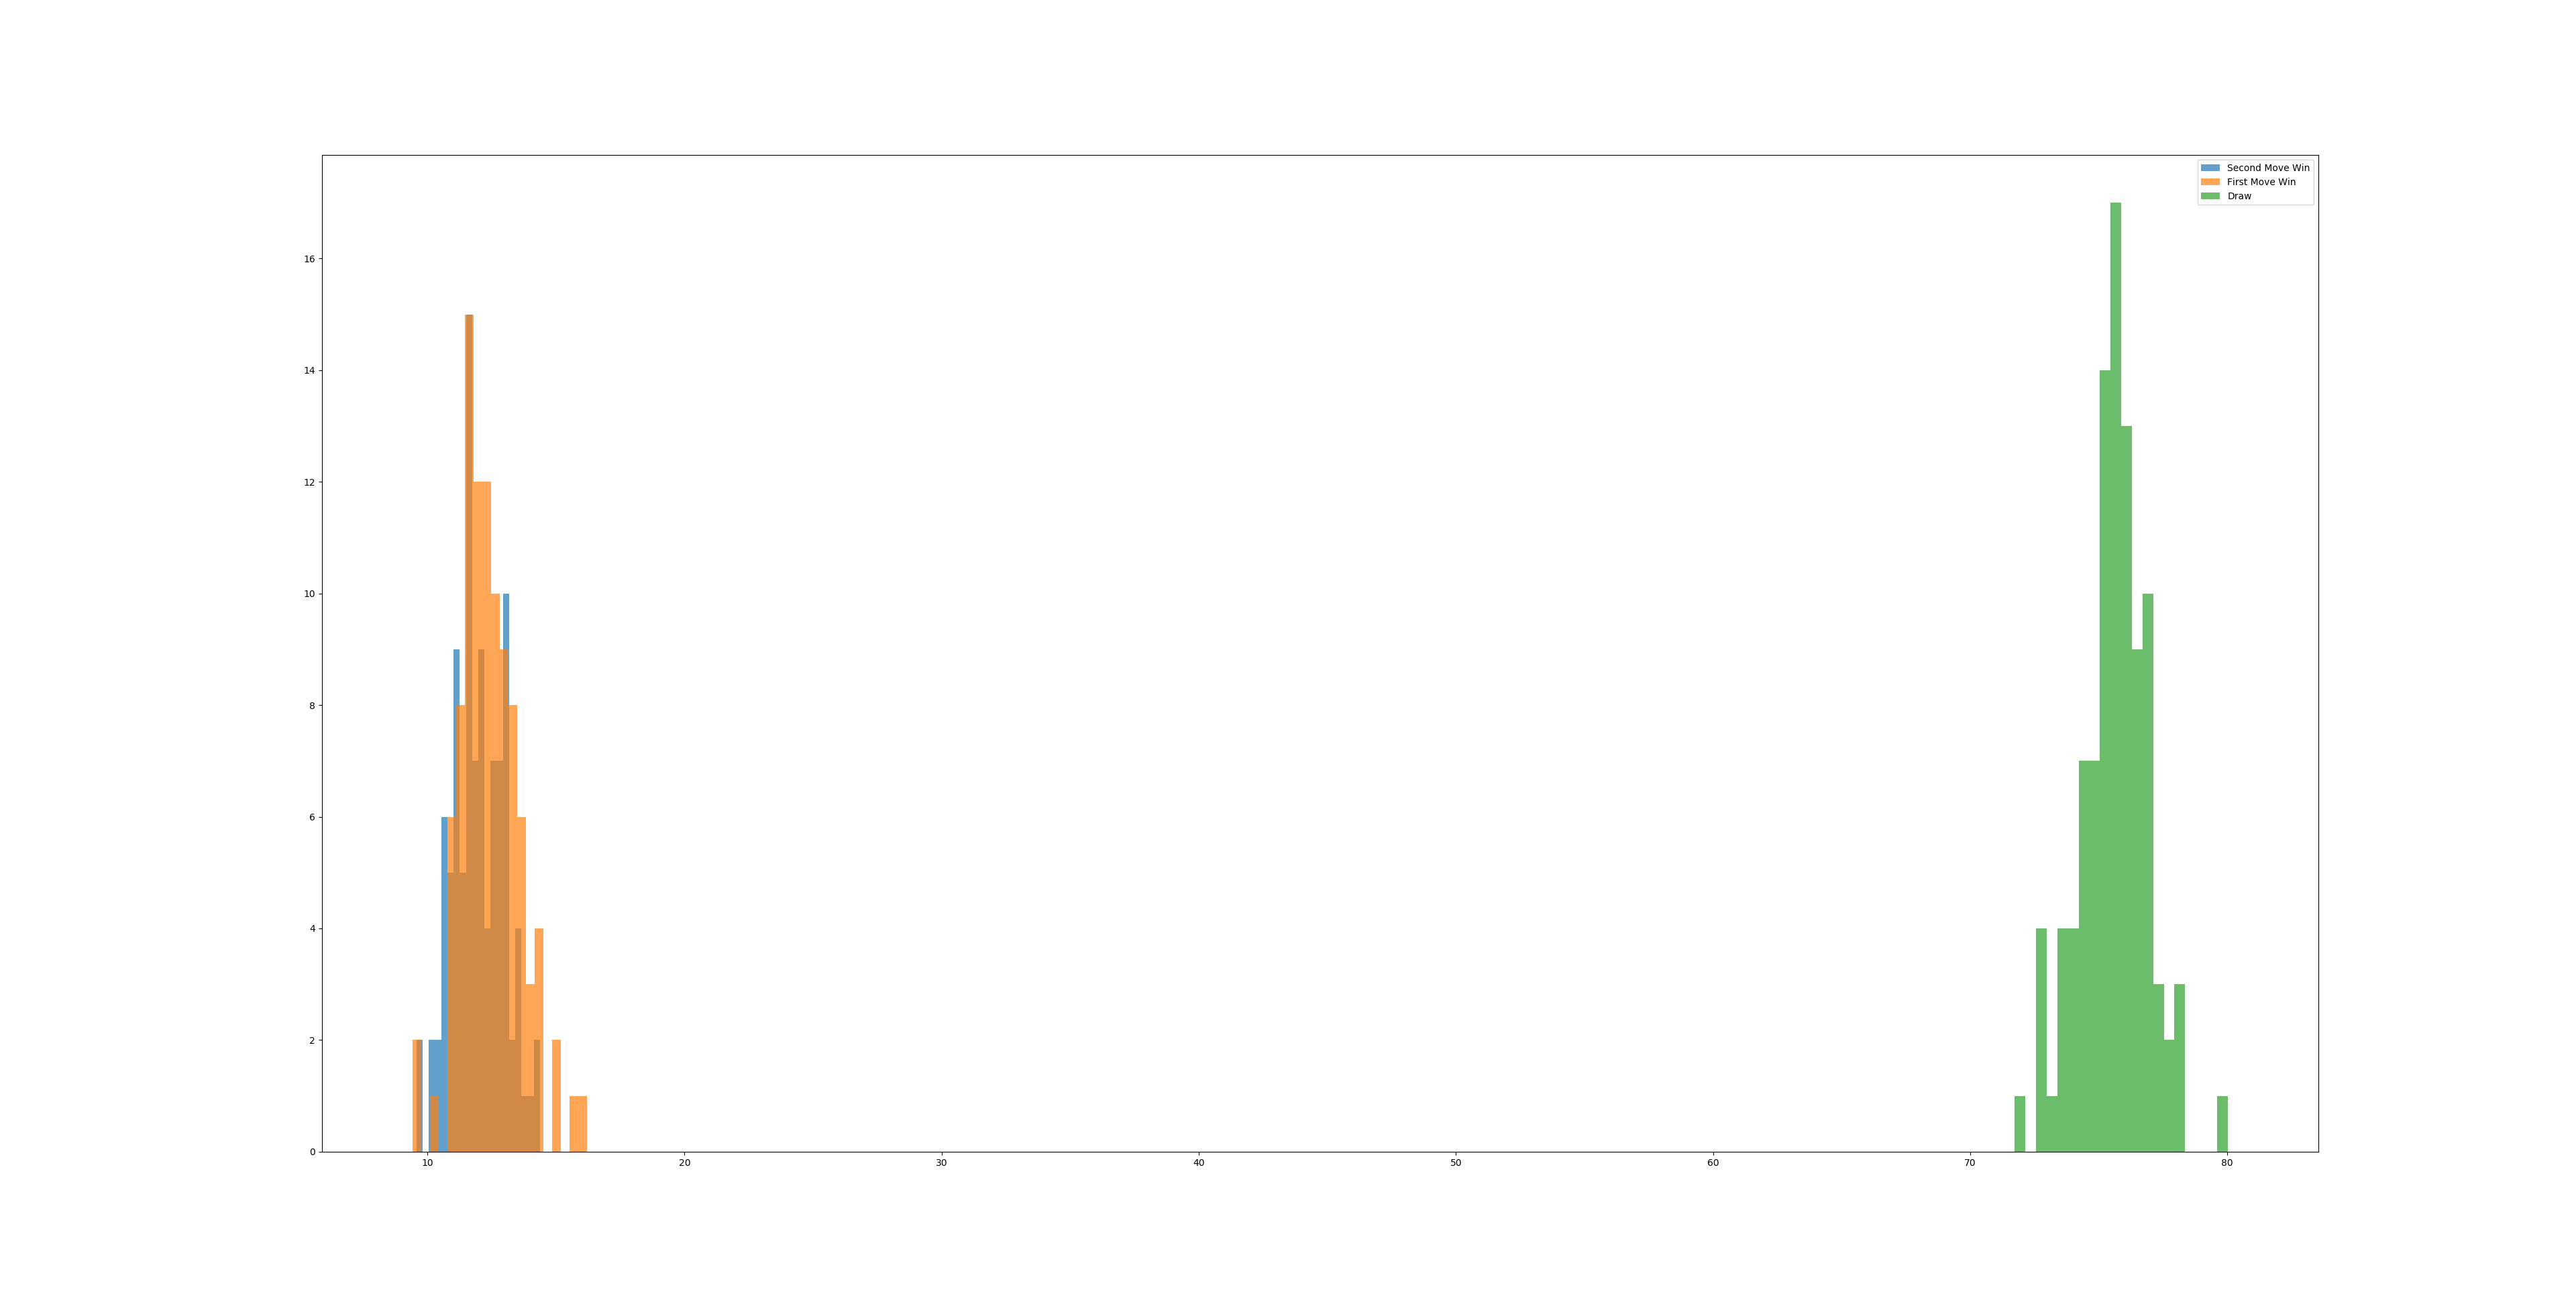
Using the same sampling approach we can again plot the percentages as a histogram.
As expected the chance to draw has now increased to ~60%! First movers win only about ~25% of the time where as second movers win only about ~13% of the time.
6 by 6 Grid:
Finally doing the same for a 6 by 6 Grid we find that there is a ~75% chance of a draw! There is also almost no difference between first movers and second movers (or very little difference) and both are in the 12 – 15% range. Thus as we increase the grid size it becomes more difficult to win and there is no real advantage in moving first.
Next Steps:
Obviously the experiments given in this post are not the final word. They can be further improved by implementing parallel processing so that we can increase the sample size (especially for larger grids).
To answer the questions we started with:
- Is there any advantage in starting first? – Yes, definitely! Right up till grid size of 5 by 5.
- How many games end in a draw or have second movers as winners? – More games end in a draw as the grid size increases. It is almost always bad to be the second mover!
- Which are the ‘best’ starting squares? – For the 3 by 3 Grid we have:
- For the first movers the best starting square by far is 5 (right in the middle and opens up 4 winning lines – most of any starting square, all other squares open up to 3!). Second best option then becomes the corners (1, 3, 7, 9)
- For the second movers the best starting squares are 2, 4, 6, or 8 (a diamond pattern).
- How are these factors affected by grid size? – As the grid size increases a draw becomes more likely.
Larger Sample Sizes:
What if we increase the sample size from 10000 to 100000 (a factor of 10)?
Let us see what happens to the spread of the first movers, second movers and draws in case of 5 by 5 Grid and 4 by 4 Grid:
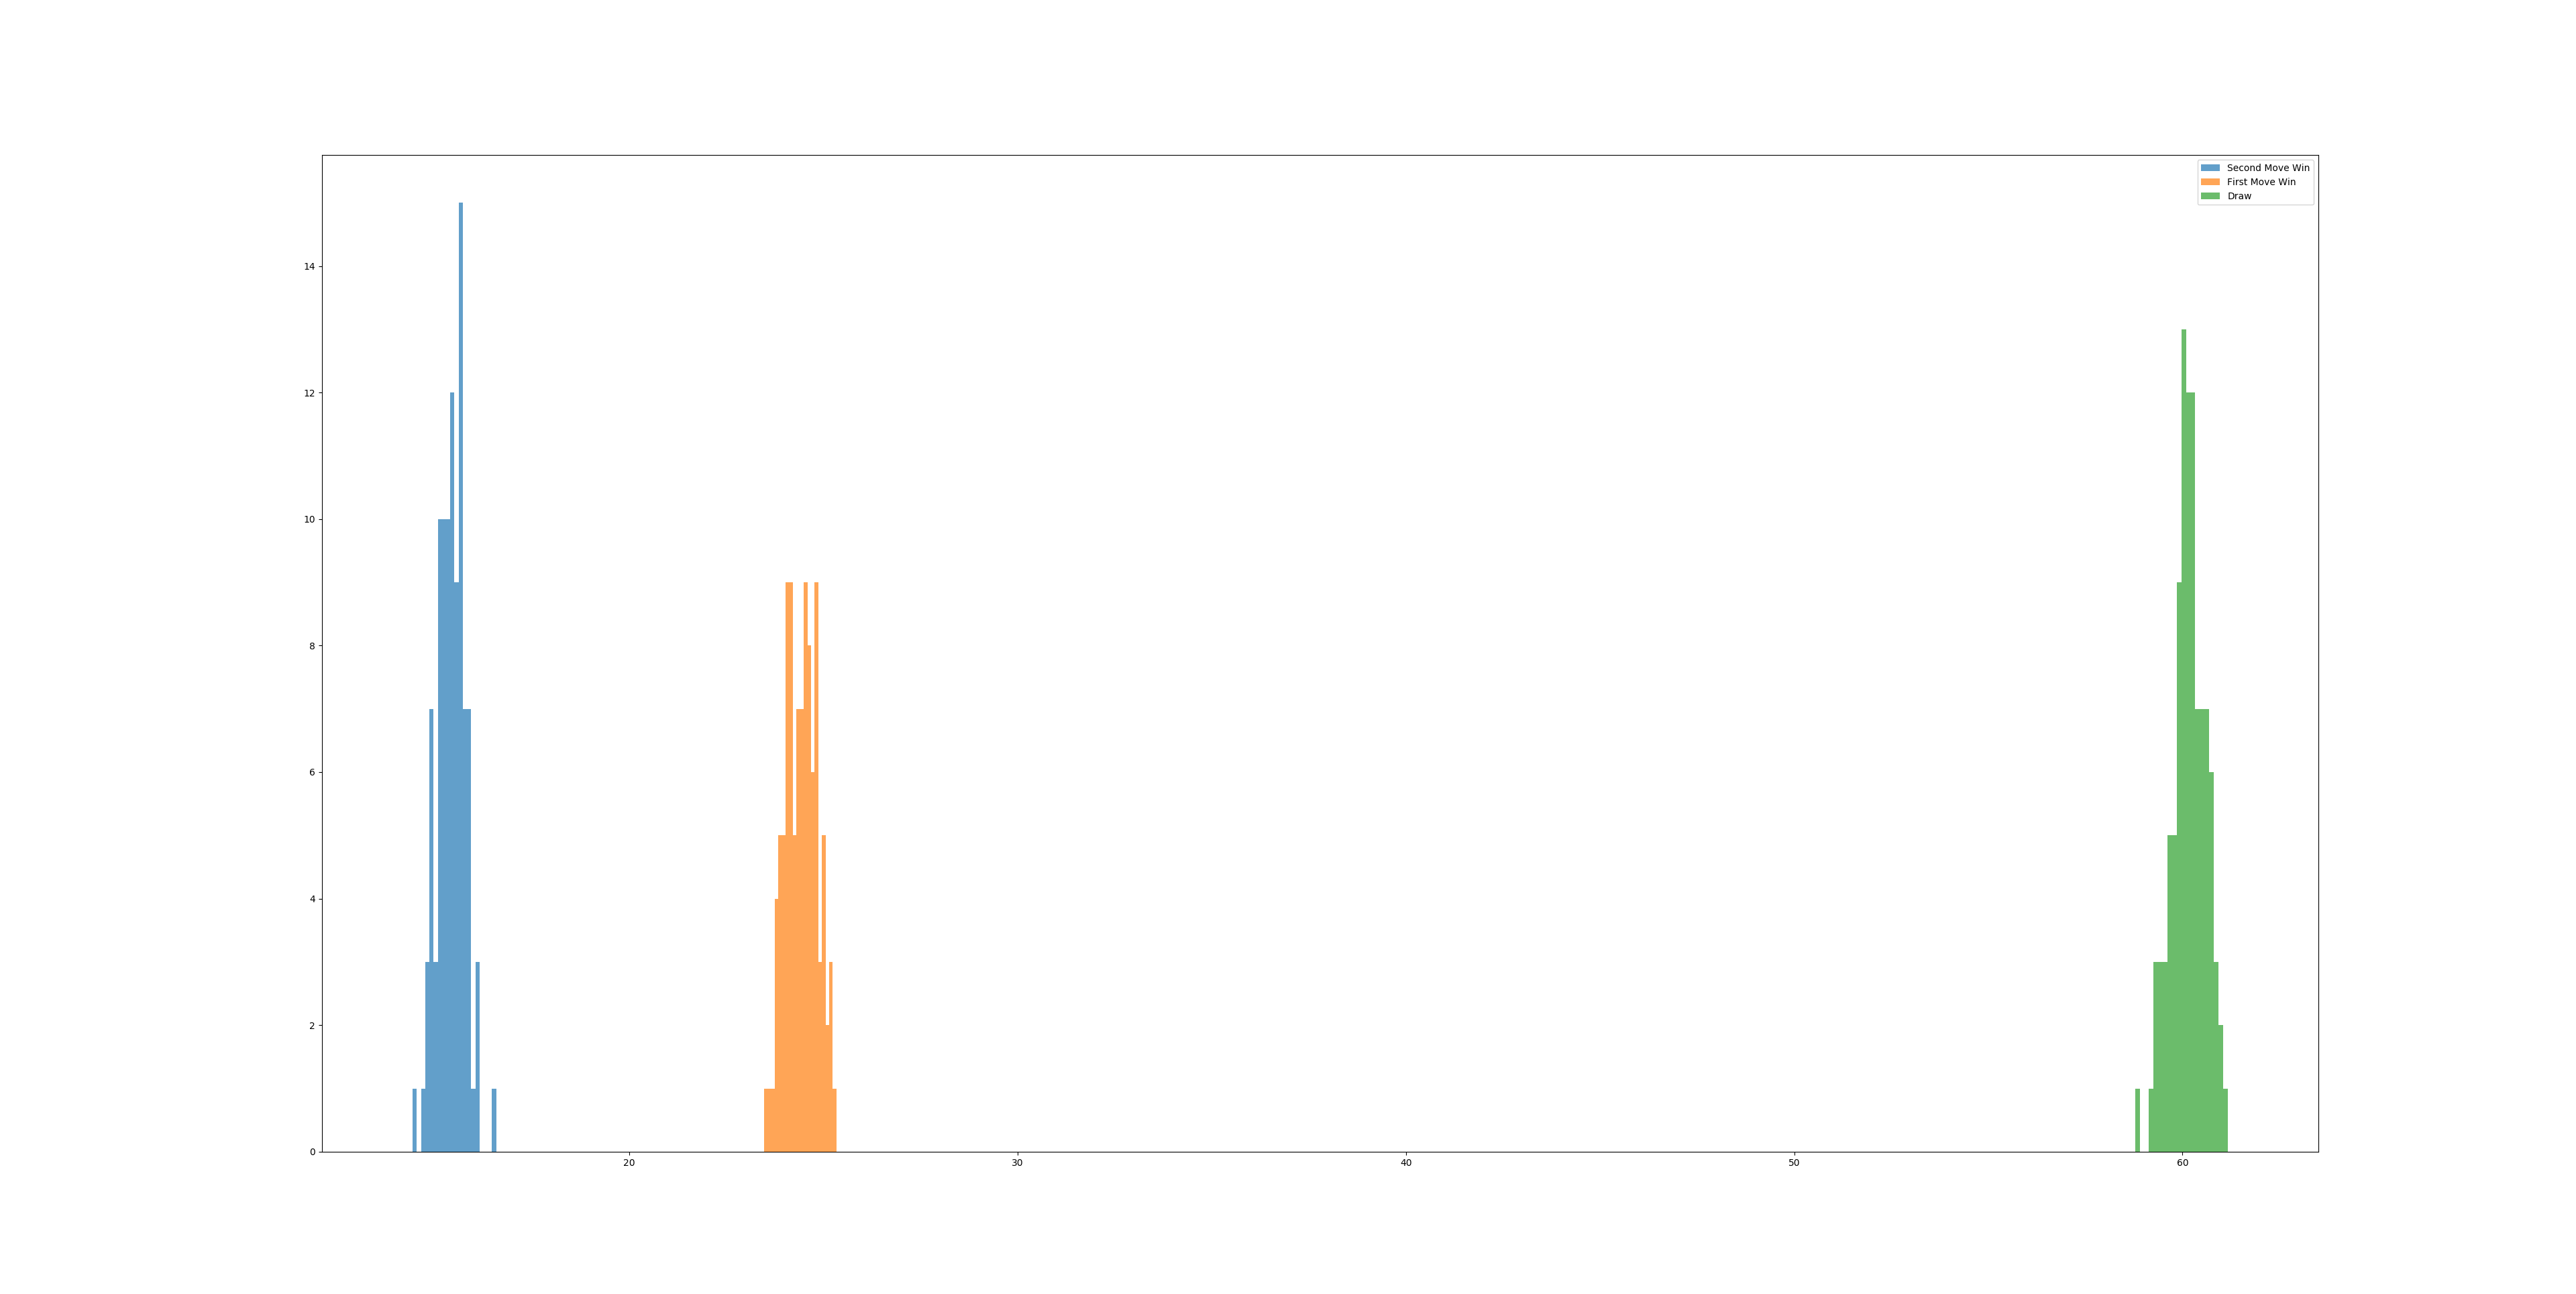

The spread is now far less as compared to the 10000 sample graph. This means we get the percentage values with higher degree of accuracy. The spread looks more like Burj Khalifa than the Shard!
Tic Tac Toe python code file can be found HERE!
