2021 Edition of the 2020 T20 World Cup (Mens) has been a strange one. Delay and change of venue caused by Covid-19 and the 3 stage format that included Associate Teams like Namibia and Papua New Guinea battling it out with past champions like Sri Lanka for a place in the second stage, to name a few. For the second stage the asymmetric nature of the two groups was also puzzling. But for me the most important ‘failure’ was the result depending on the toss.
At the beginning of the game a coin is tossed and the winning Captain gets to choose whether to bat first or bowl first. In this post I analyse who won the toss and what they decided to do and the impact it had on the result of the game.
Figure 1 shows in the top-left pie shows the outcome of winning the toss (independent of the decision) and how it relates to the result. We can see 2/3rd (66%) of the matches are won by the team that wins the toss. If we look at the bottom-left pie which takes into account whether the winner batted first we see again about 2/3rd (66%) of the teams that decided to bowl first won the match.
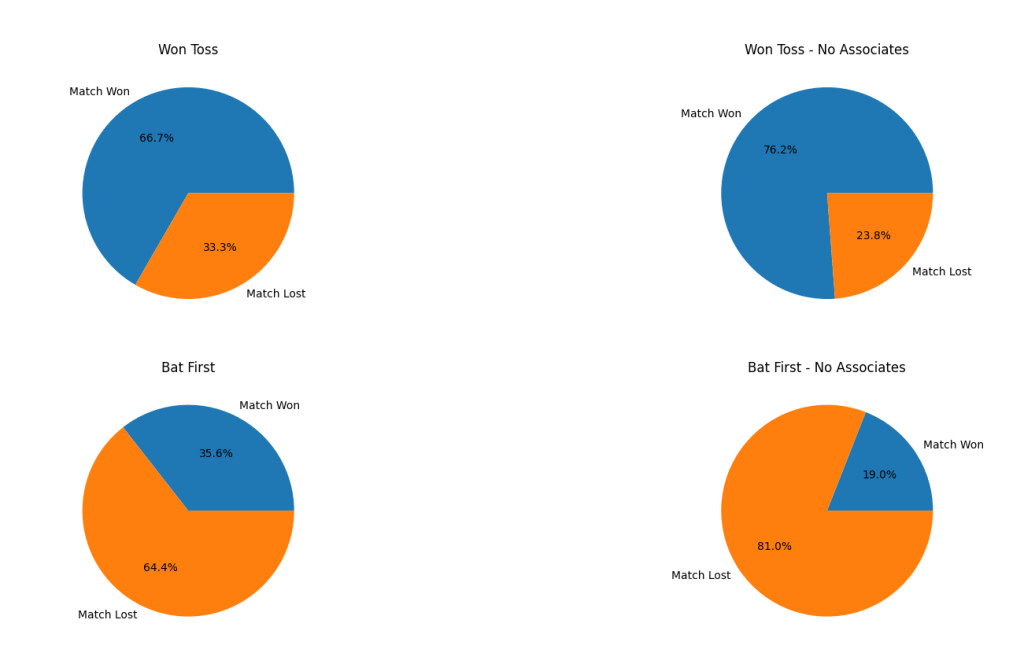
The left column is data from all the matches therefore we can have some errors creeping in because matches against Associate members are less likely to be impacted by the toss. This is because an experienced team is likely to dominate an Associate member irrespective of whether they bat or bowl first. The right column shows the data from matches that did not involve an associate team (i.e. not against Afghanistan, Scotland, Netherlands, Namibia, Oman, PNG).
Here the relationship between winning the toss, choosing to bowl first and winning is even stronger. About 76% of the teams that won the toss, won the match. 4/5th (80%) of the teams that decided to bowl first won the match.
Below we combine the Toss Outcome, Decision and Match Result and put into one of four buckets: [Toss Won-Bat First-Won], [Toss Won-Bat First-Lost], [Toss Won-Bowl First-Won] and [Toss Won-Bowl First-Lost].
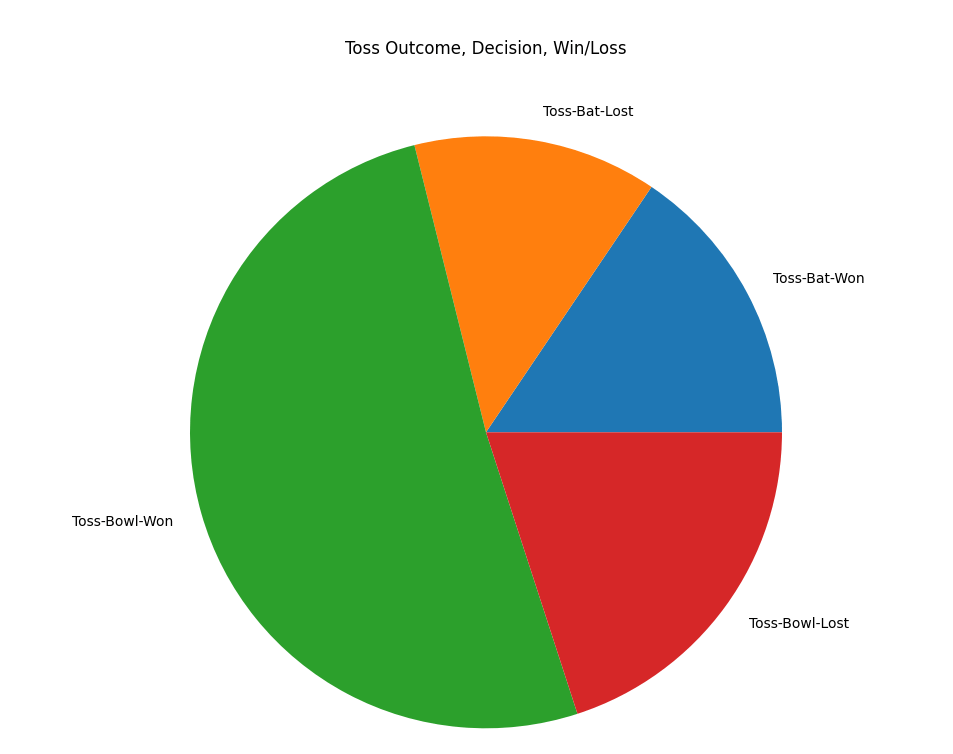
Figure 2: Toss Outcome, Decision and Match Outcome
Again showing all the matches in Figure 2 we see >50% of the matches fall in [Toss Won-Bowl First-Won] bucket.
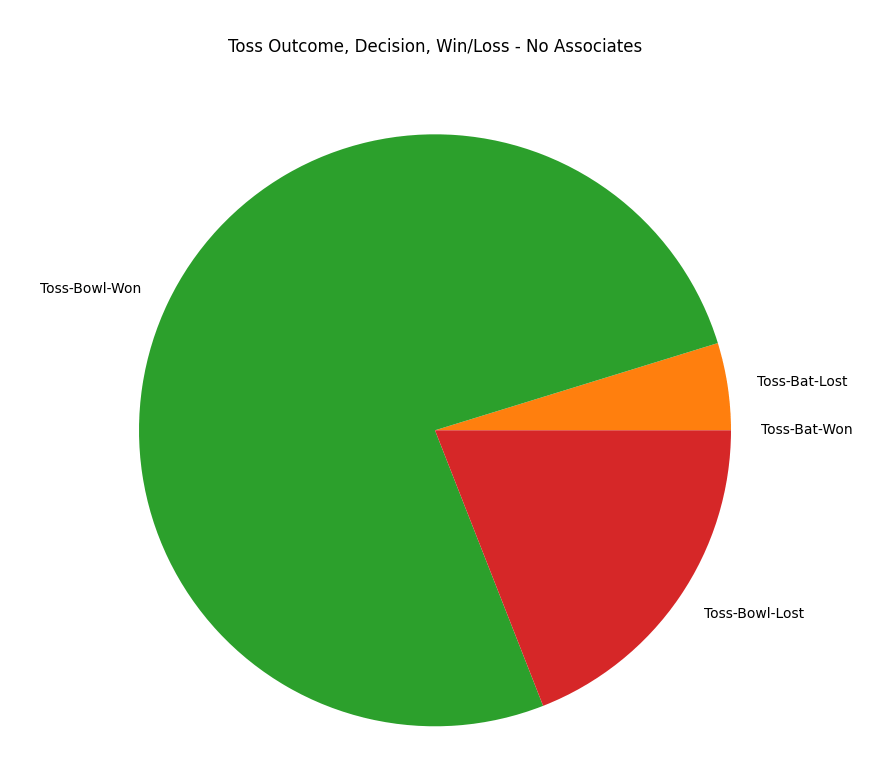
In Figure 3 we remove any matches that involve Associates. We find >75% matches fall in the [Toss Won-Bowl First-Won] bucket.
This tells me that in this T20 World Cup the toss decided to a great extent what the result will be. Most teams, upon winning the toss, decided to bowl first and ended up winning. So much so that most teams upon winning the toss decided to bowl first (>90% in Non-Associate matches and about 70% in all matches).
Maybe it was the grounds being in the same region that resulted in the above? Would we have seen a different result, one less dependent on the toss, if the WC had been played in India?
