In my previous post I described how to setup time-series collections in MongoDB and run time-series queries on property transaction dataset.
In this post I am going to showcase some data pipelines that use Mongo Aggregations and some time-series forecasts using TensorFlow and statsmodel libraries (as a comparison).
Architecture Overview
Using the AI-Infrastructure Alliance reference architecture as the base (see below):
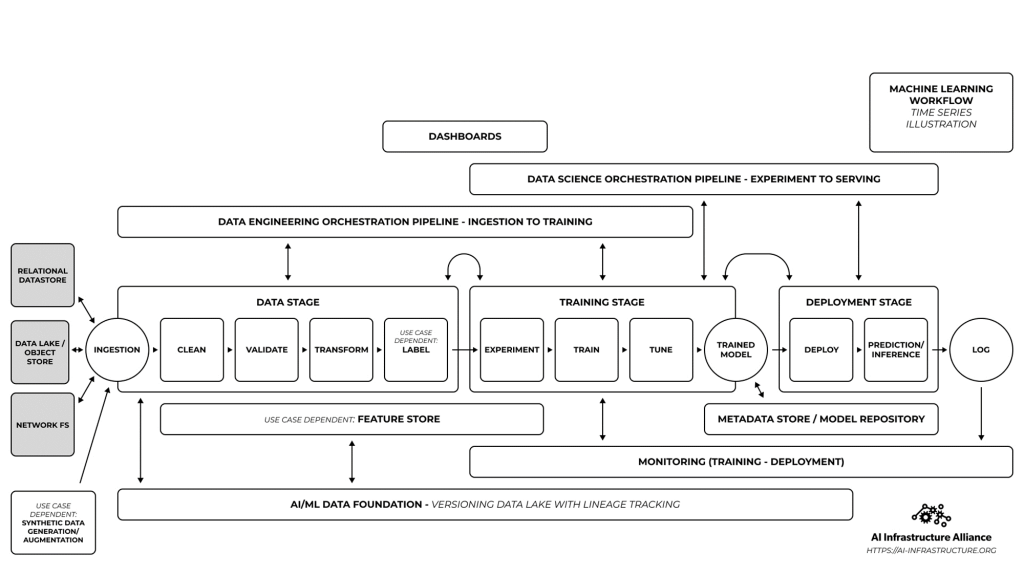
For this example there are three main components:
- MongoDB aggregation pipelines that build the…
- Feature File associated with the forecasting task which is used by the…
- Python program to build a forecasting model using Statsmodels and Tensorflow
These map to the AI-IA reference architecture as below:
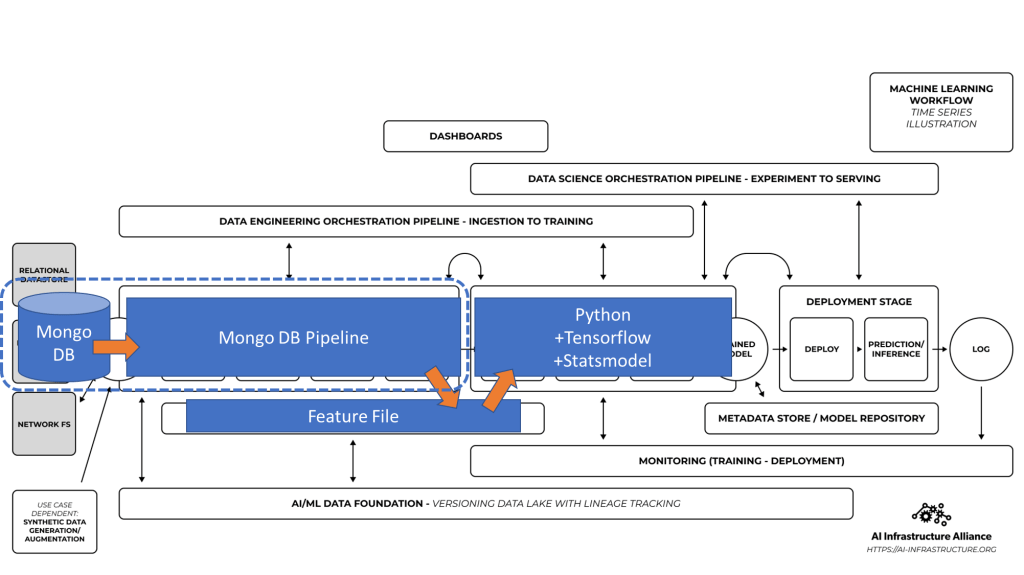
The Aggregation Pipeline
We leave the heavy lifting Feature creation to Mongo DB. The pipeline takes the ‘raw’ data and groups it by month and year of the transaction – taking average of the price and count of transactions in a given month. Then we sort it by the id (month-year) to get the data in chronological order.
The feature that we will attempt to forecast is the monthly transaction count.
pipeline = [
    {
        "$group": {
            "_id":{

                "year":{"$year":"$timestamp"},
                "month":{"$month":"$timestamp"}

            }
            ,
            "avgPrice": {"$sum": "$price"},
            "txCount": {"$sum": 1}
        }
    },

    {
        "$sort": {
            "_id":1
        }
    }

]
The output looks something like below where on the X-axis we have the month-year of the transactions and on Y-axis the monthly transaction count.
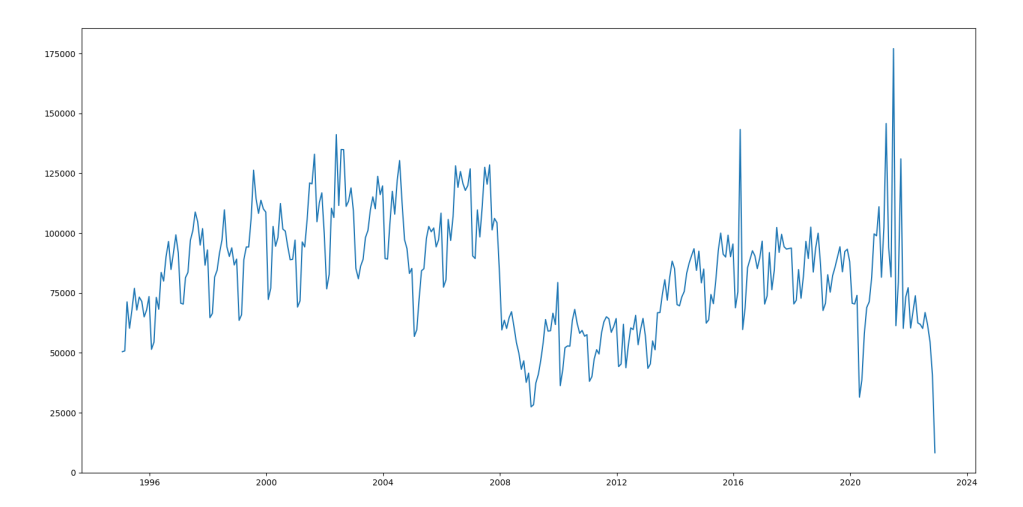
Looking at above we can see straight away this is going to be an interesting forecasting problem. This data has three big feature points: drop in transaction volumes post 2008 financial crash, transaction spike in 2014 just before stamp duty changes and then towards the right hand side the pandemic – recovery – panic we are in the middle of.
The features data is stored as a local file which is consumed directly by the Python program.
Forecasting Model
I used the Statsmodels TSA library for their ‘out of the box’ SARIMAX model builder. We can use the AIC (Akaike Information Criteria) to find the values for the order of Auto-regression, difference and Moving-Average parts of SARIMAX. Trying different order values I found the following to give the best (minimum) AIC value: [ AR(4), Diff(1), MA(2)]
I used Keras to build a ‘toy’ NN-model that takes the [i-1,i-2,…, i-m] values to predict the i’th value as a comparison. I used m = 12 (i.e. 12 month history to predict the 13th month’s transaction count).
The key challenge is to understand how the models deal with the spike and collapse as we attempt to model the data. We will treat the last 8 years data as the ‘test’ data (covering 2015-2022 end). Data from 1996 – 2014 will be used to train the model. Further we fill forecast the transaction count through to end of 2023 (12 months).
The result can be seen below.
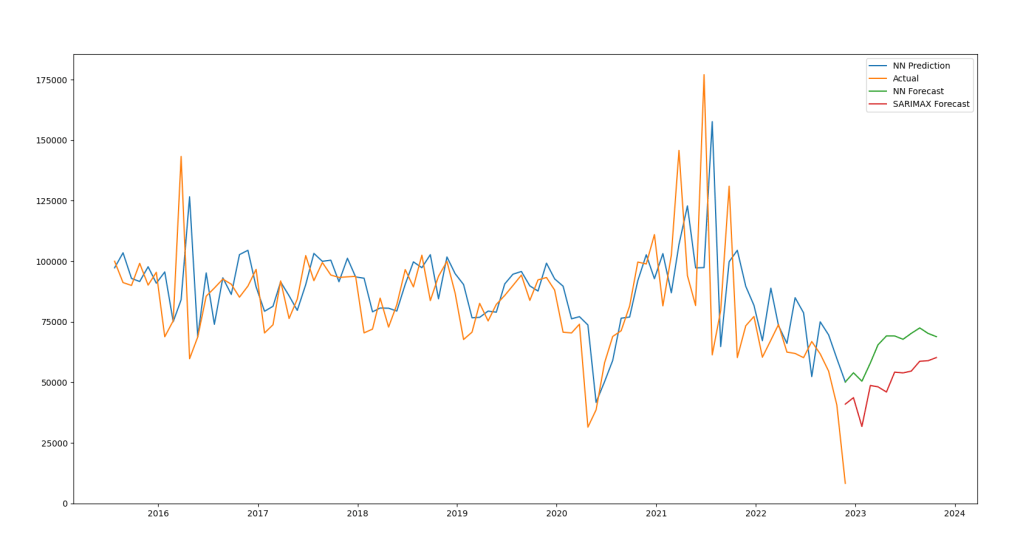
The Orange line is the monthly count of transactions from 2015 till Dec. 2022. We can see a complete crash thanks to the jump in mortgage interest rates after the now infamous ‘mini-budget’ under Liz Truss. Blue line is the value predicted by the ‘toy’ NN model. You can see the gap as the model ‘catches-up’ with the actual values. The Green line is the forecast obtained using the same NN model (beyond Dec. 2022). The Red line is the forecast obtained using the Statsmodels SARIMAX implementation.
We can see that the NN model fails to follow the dip and shows an increase as we reach the end of 2023. The SARIMAX model shows similar trend but with few more dips.
Next: Using a recurrent neural network – digging deep 🙂
Data and Stuff
The Forecast file can be found here: https://drive.google.com/file/d/1qyeo1AWioqmSEyNJwlAZbWAf23oW0CPd/view?usp=share_link
The Feature file can be found here:
https://drive.google.com/file/d/17VsCY7p9e7uoHrzHb7TJj9bFQzjSyagx/view?usp=share_link

1 Comment